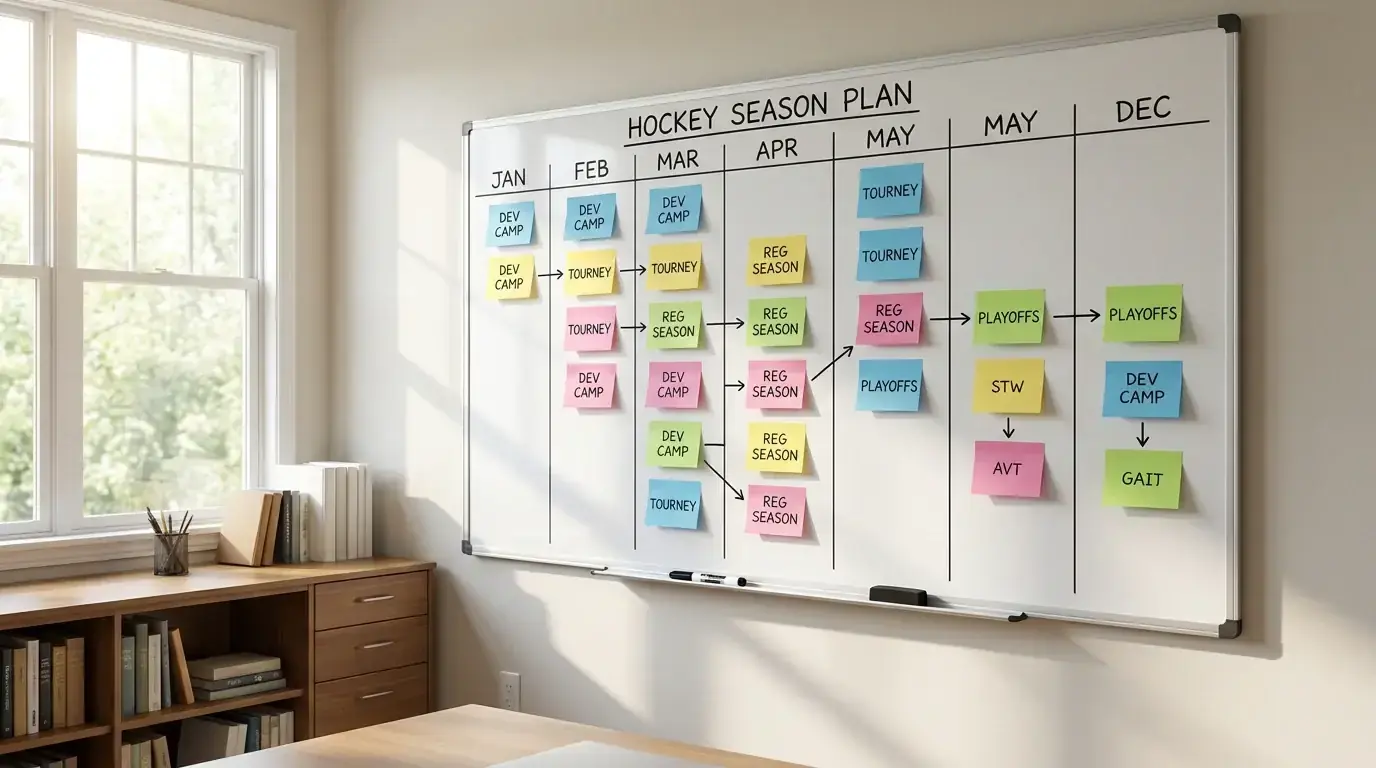


I spent my first two seasons of NHL betting doing what most people do: reading previews, trusting gut feelings, and backing teams I liked. My results were exactly what you’d expect — random. Some months I was up, most months I was down, and I couldn’t tell you why either outcome happened. The turning point came when I stopped trying to predict winners and started building a process. Not a system that promised 70% win rates or some fantasy ROI, but a repeatable method for identifying spots where the bookmaker’s price was wrong.
That distinction — process over prediction — is what this guide is about. NHL underdogs won 39.1% of games outright in 2024-25, a rate second only to baseball among major North American sports. In a league where the “wrong” team wins four out of ten times, picking winners is a mug’s game. Finding mispriced odds is a craft. The strategies here are the ones I use every day, refined over eight years of tracking bets, recording outcomes, and throwing away the approaches that didn’t survive contact with reality.
The Value Identification Process
There’s a moment in every profitable bettor’s development where they stop asking “who will win this game?” and start asking “what is this team’s true probability of winning, and does the bookmaker’s price understate it?” That mental shift sounds small. It changes everything.
Value exists when the implied probability embedded in a bookmaker’s odds is lower than the actual probability of the outcome. Decimal odds of 2.50 imply a 40% chance. If your analysis puts the true probability at 46%, you have value — not a guaranteed win, but a bet that, placed repeatedly, produces profit over time. This is the only definition of value that matters.
My process for finding it in NHL markets starts with three filters. First, I check the home/away split. Home teams won 56.6% of games in 2024-25, with home underdogs covering against the spread 63.9% of the time compared to just 41.8% for home favourites. That’s not a small gap — it’s a structural inefficiency. The public overvalues favourites and undervalues the home underdog, which means the price on home underdogs is consistently richer than it should be.
Second, I look at goaltending. This is non-negotiable. A team’s moneyline price shifts by 10-15 cents depending on which goaltender starts, and the bookmaker doesn’t always adjust quickly enough when a backup is announced late. I won’t place a bet until the starting goalies are confirmed, full stop.
Third, I assess the schedule context — rest days, travel, back-to-backs. A team playing the second half of a back-to-back on the road against a rested opponent faces a compounding disadvantage that isn’t always priced in. When all three filters align — home underdog, quality starter confirmed, opponent on a schedule disadvantage — I have a bet worth sizing up. When only one or two line up, I either reduce my stake or pass entirely.
A practical example: say Team A is at home, priced at 2.40 on the moneyline (implying roughly 42% win probability). They’re starting their number-one goaltender, who has a .918 save percentage. Their opponent is on the second night of a back-to-back and starting a backup. My model, factoring in goaltending, home advantage, and schedule, puts Team A’s true win probability at 48%. The bookmaker’s price implies 42%. That 6% gap is the value. I don’t know if Team A wins tonight — but I know that if I take this bet a hundred times in similar spots, I come out ahead.
The hardest part of value betting isn’t the maths. It’s the patience. Value spots don’t appear every night. Some weeks I bet on twelve games, other weeks I bet on three. The discipline to pass when the price isn’t right is what separates a strategy from a hobby.

Schedule Awareness
Last February, I faded a conference-leading team three times in eight days. They lost all three. My secret? I didn’t know something nobody else knew. I read the schedule. Two of those games were the back end of back-to-backs, and the third came at the tail end of a five-game road trip through three time zones. The information was public. Most people just didn’t look.
The NHL regular season is an 82-game marathon — expanding to 84 in 2026-27 — crammed into roughly seven months. That density creates pockets of fatigue that are both predictable and exploitable. Home teams won 56.6% of their games overall in 2024-25, but that number masks significant variation based on rest. A rested home team facing a travelling opponent on a back-to-back wins at a meaningfully higher rate than the baseline, while a home team playing its own back-to-back sees that advantage erode sharply.
Back-to-backs are the most discussed schedule spot, but they’re not the only one. The “three games in four nights” cluster is nearly as punishing. So is the long road trip — five or more games away from home, crossing multiple time zones. Western Conference teams playing in the Eastern time zone (or vice versa) face a circadian disadvantage that compounds with travel fatigue. Coaches frequently rest their starting goaltender on the second night of a back-to-back, which means you’re not just getting a tired team — you’re getting a backup netminder as well.
My workflow: every Monday morning, I pull the full week’s schedule and highlight every back-to-back, every three-in-four, and every game where a team is crossing two or more time zones. Those highlighted games go on a watchlist. On game day, once lineups and goaltenders are confirmed, I check whether the bookmaker has adequately priced the fatigue factor. Often they have. Sometimes they haven’t. A deeper look at how to exploit back-to-back games specifically covers the entry rules I use in those spots.
One nuance that gets overlooked: not all back-to-backs are equal. A team playing at home both nights has a very different profile from a team that played in Chicago on Tuesday and flies to Denver for Wednesday. The travel component compounds the fatigue component, and the goaltending decision (starter vs backup) compounds both. I weight road back-to-backs roughly twice as heavily as home back-to-backs in my analysis, and the results over three seasons justify that weighting. Context is everything — a blanket rule like “always fade the team on a back-to-back” is too crude to be profitable.

Line Movement and Timing
I used to place my bets the moment I finished my analysis — usually around midday on game day. Then I noticed something irritating: the lines I bet at lunchtime were consistently worse than the lines available at 9 AM. Not by huge amounts, but 1.95 versus 1.88 on the same side, multiplied across a season, is the difference between profit and treading water.
NHL lines open the night before a game and move based on the weight of money coming in. The early morning period — before the general public wakes up and places bets — tends to reflect sharp opinion. Professional bettors hit the market first because they know the value is richest when the lines are freshest. By mid-afternoon, the casual money has pushed the line toward the popular side, and the price you get is worse.
The NHL’s betting handle grows every year, and that growth isn’t evenly distributed across the day. The heaviest action concentrates in the hours before game time, which means the biggest line movements happen in the final few hours. Bettman himself has said he doesn’t believe hockey is susceptible to match-fixing the way other sports might be — and that confidence stems partly from the infrastructure the league has built around betting integrity. For bettors, that infrastructure means the markets are clean, which means the sharp money hitting the lines early is based on genuine analysis rather than manipulation. If you’re a UK-based bettor, the timing works in your favour: NHL lines open in the early hours of your morning and settle through your workday, with most games starting between 11 PM and 2 AM GMT. Placing bets in the early evening — when lines have been out for hours but the late rush hasn’t started — often captures a useful window.
Reverse line movement is the most reliable signal that sharp money has entered the market. If 70% of public bets are on Team A but the line moves toward Team B, the bookmaker is adjusting for large, respected wagers on the less popular side. I don’t chase reverse line movement blindly, but when it aligns with my independent analysis, it’s a confirmation signal that gives me confidence to commit full units.
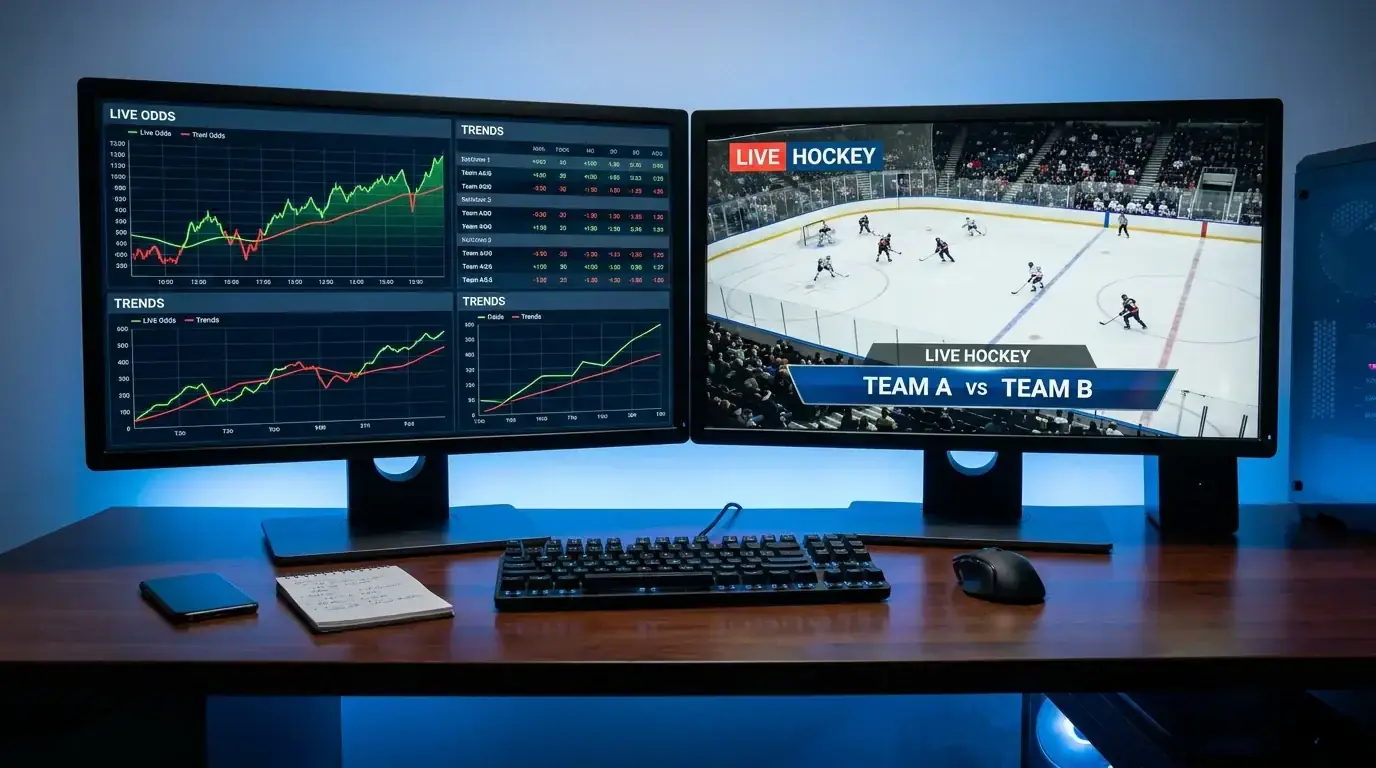
There’s a specific timing trap for UK bettors worth flagging. Because NHL games start late at night our time, the temptation is to place bets in the early afternoon and then forget about them. The issue is that goaltender confirmations often come out between 4 and 6 PM GMT — after many UK bettors have already locked in their plays. If the confirmed starter differs from what the market expected, the line can move sharply. My rule: if a game hinges on the goaltender matchup (and most do), hold off until the confirmation comes through, even if it means betting closer to puck drop than I’d like. Missing the best line by a few cents is less costly than betting the wrong side because the backup unexpectedly got the start.
In-Play Strategy
Here’s something I rarely see discussed in betting guides: the best live bets are the ones you planned before the game started. Walking into a live market with no pre-game framework is like walking into a car dealership without knowing what you want — you’ll end up paying too much for something you didn’t need.
My approach to in-play NHL betting is selective. I identify one or two games per night where I have a strong pre-game lean but the pre-game price doesn’t offer enough value. Then I wait. If the game flow moves in my favour — the team I like concedes an early goal, say, or falls behind on the shot clock despite controlling play — the live price improves beyond the pre-game number, and I step in.
The specific scenarios I look for: a strong favourite trailing 1-0 in the first period on a fluky goal while leading in shot attempts and expected goals. Their live moneyline price might jump from 1.55 pre-game to 2.10 in-play, but the underlying game state hasn’t changed — they’re still the better team, and they’ve got forty minutes to prove it. That’s a buying opportunity. Another scenario: a game listed at over/under 6.5 that’s still 0-0 deep into the first period. The live total drops to 5.5, but the shot volume suggests goals are coming. In both cases, the live market is reacting to the scoreboard, while my analysis is reacting to the process.
What I avoid: betting live on momentum. “Team B just scored two quick goals, they’ve got all the momentum!” Momentum in hockey is real but fleeting, and by the time you’ve processed it and placed a bet, the live market has already priced it in. React to process data (shots, expected goals, zone entries), not to vibes.
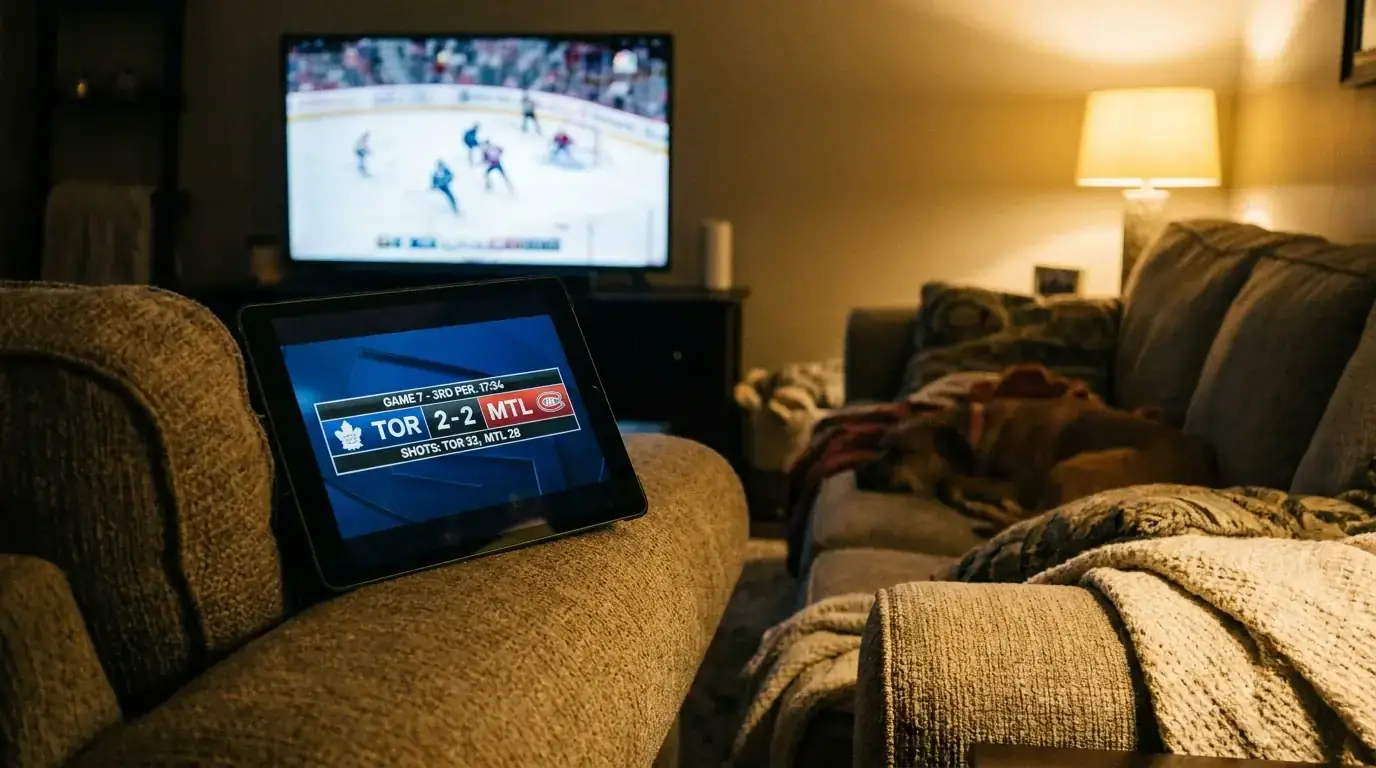
One more live betting scenario worth mentioning: the empty-net window. When a trailing team pulls their goaltender in the final two minutes, the game state shifts dramatically. The trailing team generates high-danger chances, but the leading team gets empty-net attempts. If a bookmaker offers a live next-goal market during the pulled-goalie window, the pricing can be surprisingly soft because the situation is chaotic and the market doesn’t always adjust quickly enough. I don’t bet this spot every night, but it’s produced consistent returns in my tracking over three seasons.
Staking and Discipline
I once blew through a month’s worth of profit in a single weekend. Not because my picks were bad — they were fine — but because I tripled my stakes on Saturday night after a strong Friday. The wins on Friday felt like evidence that I was “hot.” The losses on Saturday proved I was just reckless.
The staking system I’ve used since that weekend is flat-unit betting. One unit equals 1-2% of my total bankroll, and I bet the same amount on every play regardless of how confident I feel. The logic is simple: confidence is an emotion, and emotions are terrible bankroll managers. I’ve had my highest-confidence bets lose and my lowest-confidence bets win often enough that I no longer trust the feeling. What I trust is the process, and the process says that every qualifying bet gets the same unit size.
About 10% of UK adults bet on sport in any given month, and the gap between those who sustain it and those who burn out almost always comes down to money management, not selection quality. A 55% hit rate on moneyline bets at average odds of 2.00 is profitable — but only if you survive the cold streaks that are statistically inevitable over an 82-game season. Flat-unit staking ensures that a ten-bet losing streak (which will happen — I’ve had two this season alone) reduces your bankroll by 10-20%, not 80%. You stay in the game long enough for the edge to compound.
I record every bet in a spreadsheet: date, game, market, odds, stake, result, and a brief note on why I took the bet. That last column is the most valuable. When I review losing streaks, the notes tell me whether I deviated from process or simply ran bad. The answer determines whether I need to adjust my approach or just keep going.
One question I get asked constantly: “Should I increase my unit size after a winning month?” My answer is yes, but slowly. I re-evaluate my bankroll at the end of each calendar month. If it’s grown, I recalculate 1% and use the new figure as my unit. If it’s shrunk, I do the same — the unit gets smaller. This approach means I naturally scale up during winning runs and scale down during losing ones, which protects capital during cold streaks and lets me capitalise during hot ones. The adjustments are mechanical, not emotional, and that’s the whole point.

Seasonal Adjustments
The NHL season isn’t one continuous entity. It’s at least four distinct phases, and the strategy that works in October doesn’t always work in April.
The opening month is chaos. Rosters are unsettled, new players are adjusting to new systems, and the sample size of games is too small for statistics to stabilise. I bet lightly in October, focusing on schedule spots and goaltender mismatches rather than advanced metrics, because the metrics haven’t had enough games to tell a reliable story.
November through February is the core of the season. This is when I increase volume and lean on data more heavily. Corsi, expected goals, and save percentage trends are meaningful once a team has played twenty-five to thirty games, and the regular-season grind exposes the gaps between genuinely good teams and early-season flukes. The 2025-26 season was the last with an 82-game format, meaning next season’s expanded 84-game schedule will stretch this phase even further.
March is the trade deadline zone. Contenders acquire players; sellers lose their best assets. Roster upheaval creates temporary inefficiency because bookmakers haven’t fully integrated the new lineups. I pay close attention to deadline moves and adjust my ratings manually — something the algorithms powering bookmaker odds can be slow to do.
The playoffs are a different sport entirely. Regular-season trends have some predictive value, but the intensity and structure of a seven-game series changes the dynamic. Rest days disappear. Goaltenders play every game. Special teams become more important. I reduce my bet count, increase my per-bet research time, and narrow my focus to goaltending matchups and power-play efficiency. The bettors who treat the playoffs as an extension of the regular season are the ones whose money I’m trying to take.
There’s one more seasonal variable that’s easy to forget: the All-Star break and bye weeks. The NHL schedules mandatory rest periods in January and February, and teams returning from extended breaks often play sluggish first games back. The market tends to treat these as normal games, but the rust factor is real. I’ve found small but consistent value on the under in the first game after a bye week, particularly when both teams are returning from rest simultaneously. It’s not a high-volume angle, but it’s the kind of marginal edge that adds up across a season.