


In November 2022, I placed a bet on a team that was fourth in the league in goals scored, had a healthy top-six forward group, and was playing at home against a middling opponent. They lost 2-1. Their starter had a .891 save percentage over the previous ten games, and I hadn’t checked. I’d done ninety minutes of analysis on skaters, matchups, and systems — and completely ignored the one player who touches the puck more than anyone else on the ice.
That loss cost me a unit. The lesson saved me hundreds. Goaltending is the single largest variable in NHL betting outcomes, and it’s the one most bettors treat as an afterthought. The league-average save percentage in 2025-26 fell to 89.6% — below 90% for the first time since the 1993-94 season. That historic decline reshaped every totals line, every moneyline, and every prop market in the sport. If you’re not building your NHL bets around goaltending metrics, you’re bringing a knife to a gunfight.
This guide covers the metrics I use every day: save percentage and its limitations, Goals Saved Above Expected (GSAx), high-danger save percentage, workload patterns, and the confirmation workflow that ensures I never bet on a game without knowing who’s in the crease. None of these metrics work in isolation. Together, they form a goaltender evaluation framework that gives me — and now you — a genuine edge.
A quick note before we begin: the tools I describe are available for free. You don’t need a subscription to a proprietary model or a degree in statistics. What you need is the discipline to check the numbers before every bet and the patience to pass when the goaltending picture doesn’t support your thesis. That’s the real barrier, and it’s lower than you think.
Save Percentage and Its Limits
Save percentage is the first number everyone looks at and the last number you should trust on its own. I learned that the hard way after a full season of backing any goaltender sporting a .920 or better — only to watch several of them regress hard in the second half when the shot quality they faced increased.
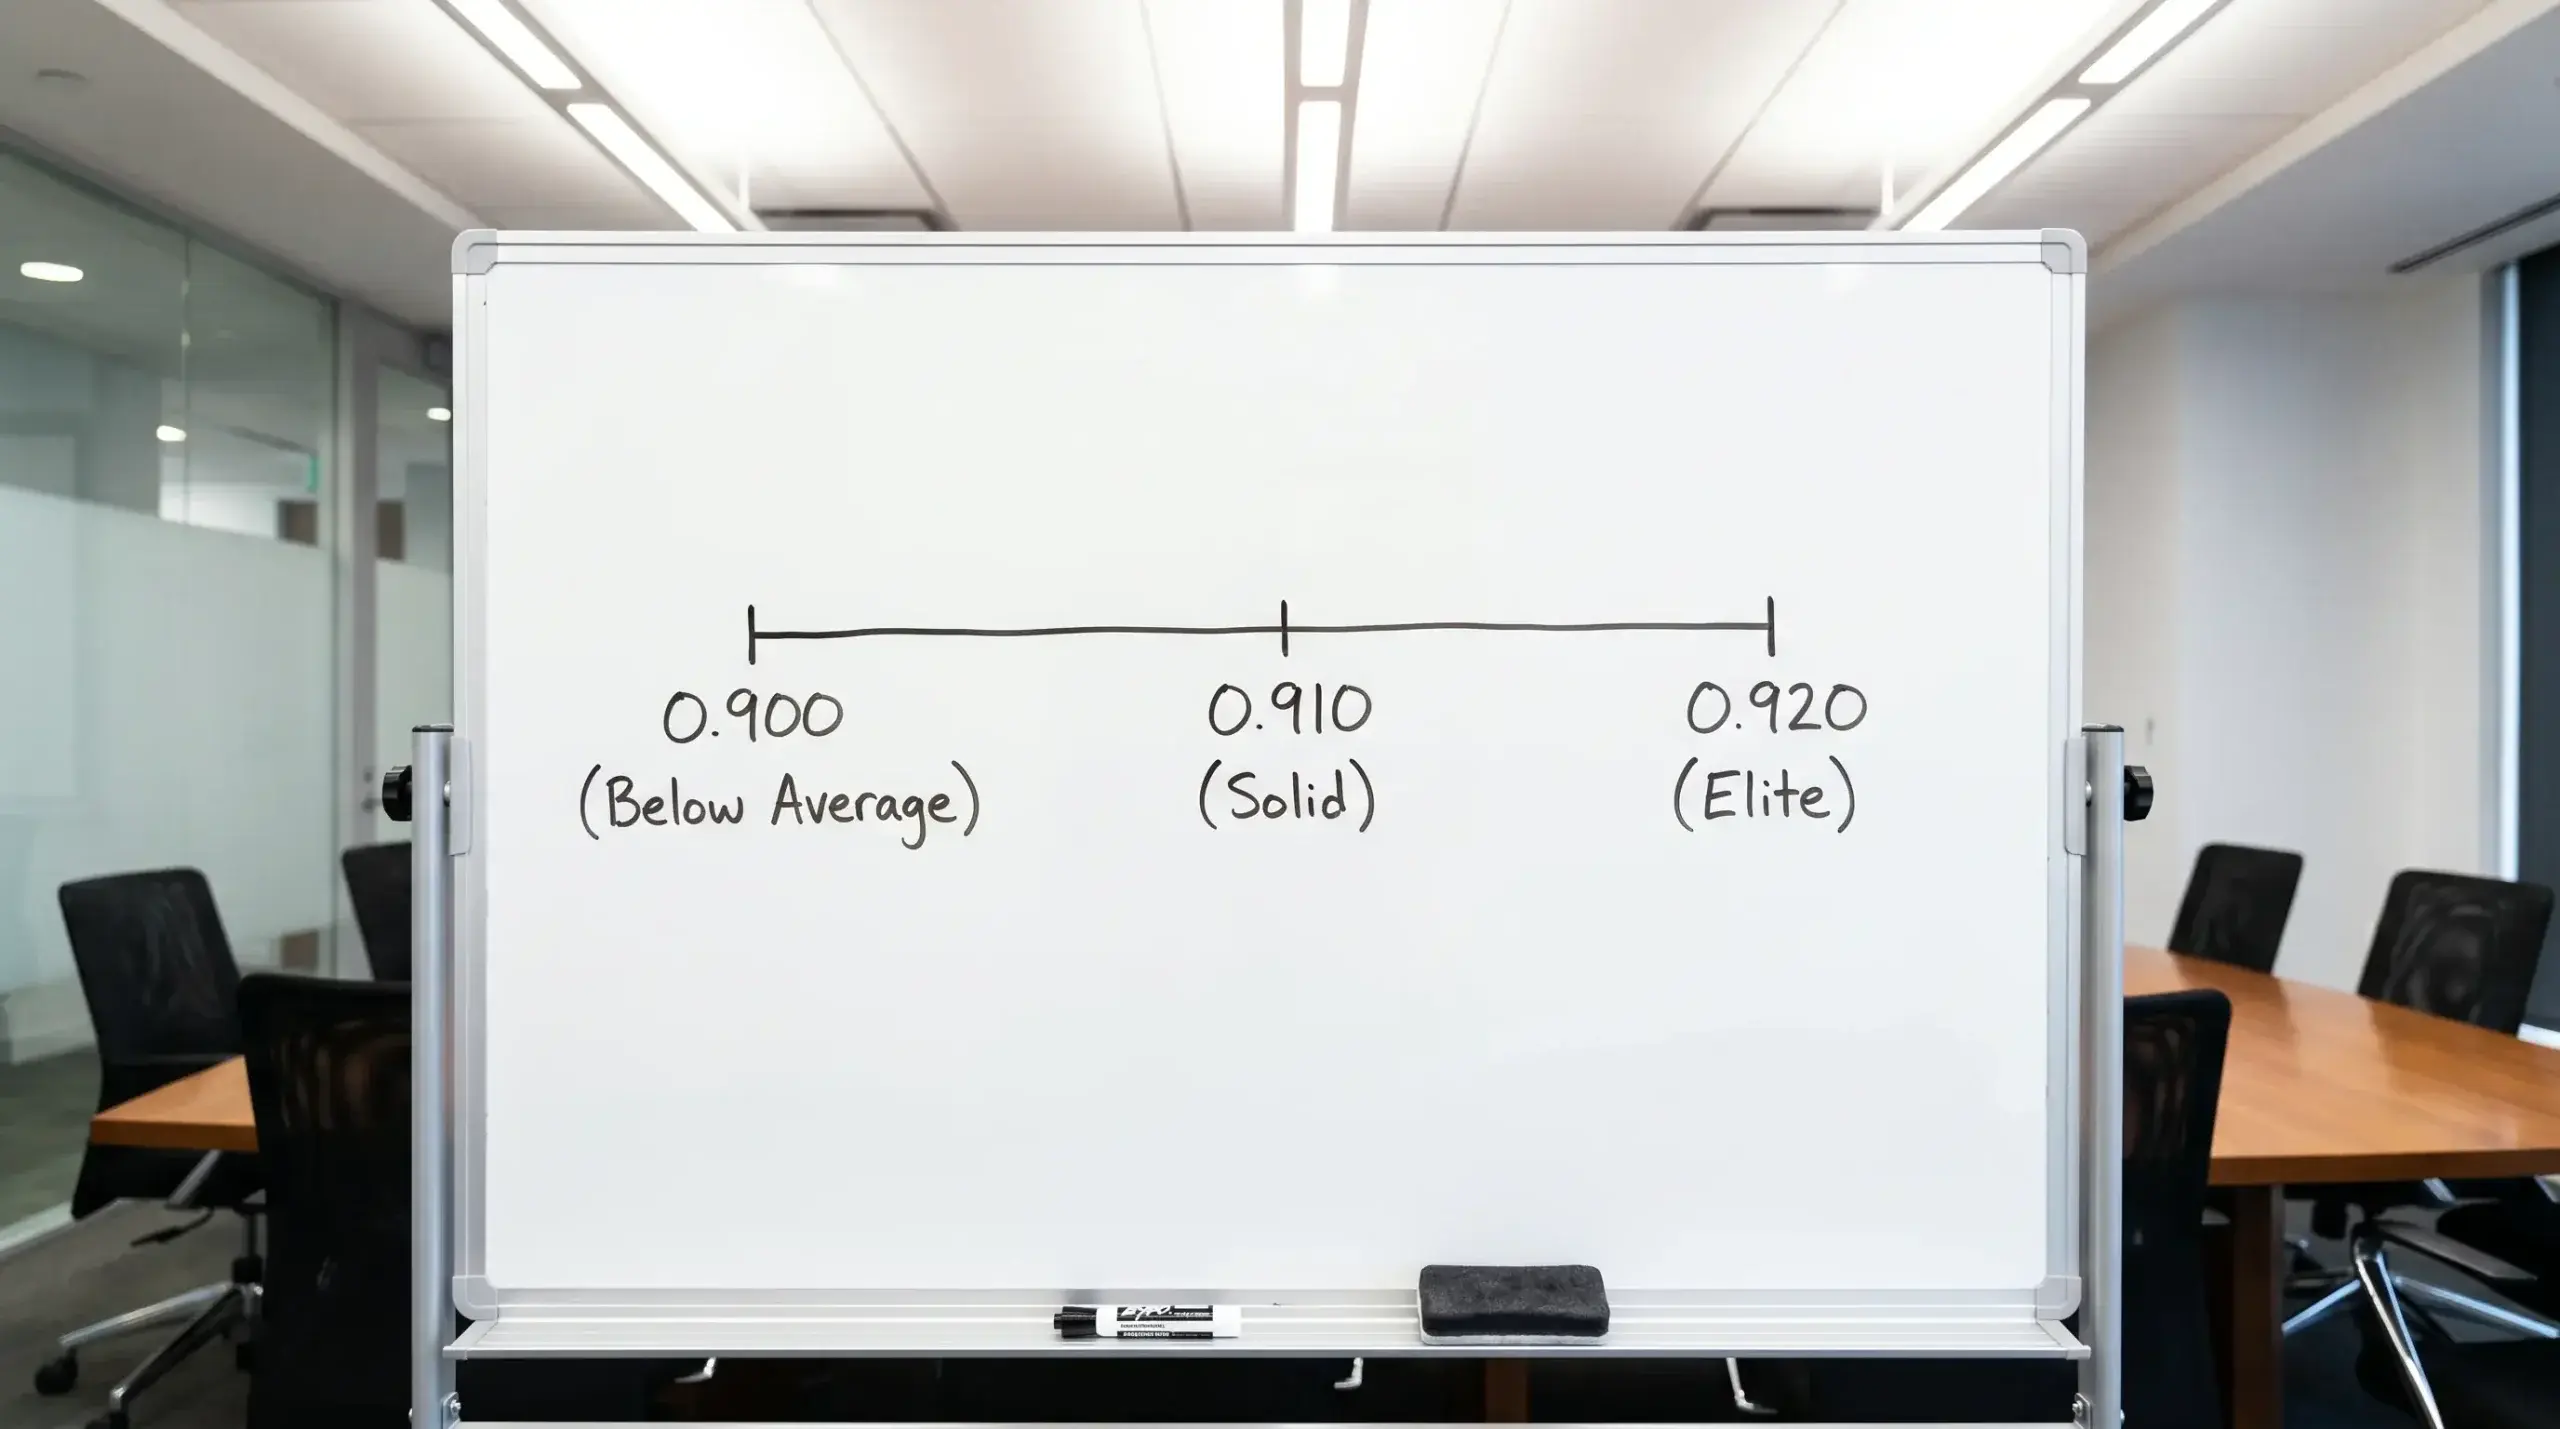
The metric is simple: saves divided by shots faced. A .910 is slightly above the current league average, .920 or higher is elite, and the leader in 2025-26 — Jesper Wallstedt — posted a stunning .936. Those thresholds are useful as rough benchmarks, but they obscure a critical problem: save percentage treats every shot equally. A 60-foot wrist shot from the blue line counts the same as a one-timer from the slot. A goaltender who faces 30 low-danger shots and stops 28 posts the same .933 as a goaltender who faces 30 high-danger chances and stops 28. Their performances are not remotely equivalent.
For betting purposes, I use save percentage as a screening tool, not a decision tool. If a goaltender’s save percentage is below .900 over a meaningful sample (fifteen-plus starts), I’m wary of backing their team regardless of what other factors look like. If it’s above .920, they go on my shortlist. But the actual betting decision comes from the metrics that adjust for shot quality — GSAx and high-danger save percentage — which I’ll get to next.
There’s one more nuance that matters for UK bettors in particular: the timing of save percentage data. The numbers published on most stats sites update after each game, but they don’t weight recent performance. A goaltender who posted a .930 in October and a .895 since January still shows a season-long .912 that looks perfectly fine. I calculate a rolling ten-game save percentage manually to capture current form, which takes five minutes per goaltender and has saved me from backing plenty of fading starters. For a deeper look at historical benchmarks and how the 2025-26 decline changes the picture, I’ve put together a dedicated analysis of save percentage thresholds.
GSAx: The Metric Bookmakers Haven’t Caught Up To
Three years ago, almost nobody in the betting community talked about GSAx. Now it’s the first thing I check. The gap between then and now is the gap between profitable and average.
Goals Saved Above Expected — GSAx — measures how many goals a goaltender saves compared to what an average netminder would save given the exact same shots. It’s built on an expected goals model that assigns a probability to each shot based on location, angle, shot type, whether it was a rebound, and whether it came off a rush. If a goaltender faces shots that an average netminder would convert into 2.5 goals but only allows 1 goal, their GSAx for that game is +1.5. Accumulate that over a season and you get a number that tells you, far more precisely than raw save percentage, how much value the goaltender is adding — or subtracting.
Why does this matter for betting? Because bookmaker odds are heavily influenced by team-level metrics — goals scored, goals allowed, standings position — and those team-level numbers bake in goaltending performance without isolating it. A team that allowed 2.5 goals per game with an elite goaltender posting a GSAx of +25 looks the same in the standings as a team that allowed 2.5 goals per game because their defensive system was strong but their goaltender was league-average. The difference only appears when you separate the goaltender’s contribution from the team’s.
This separation is where the edge lives. If a team’s strong defensive record is primarily driven by goaltending (high GSAx), and that goaltender gets injured or rested, the replacement will let in more goals than the team’s season averages suggest. The bookmaker’s line, anchored to team stats, will be too optimistic. Conversely, if a team has had poor results but their goaltender’s GSAx is positive — meaning he’s been better than the results show — there’s a case that the market underrates them.
I pull GSAx data from publicly available expected goals models (MoneyPuck is my primary source) and cross-reference with Evolving-Hockey. When a starter with a GSAx below -5 is in goal, I look to fade. When a starter with a GSAx above +10 is playing behind a team the market is undervaluing, I look to back. These thresholds aren’t magic — they’re starting points that reduce the universe of games to the ones worth investigating further.
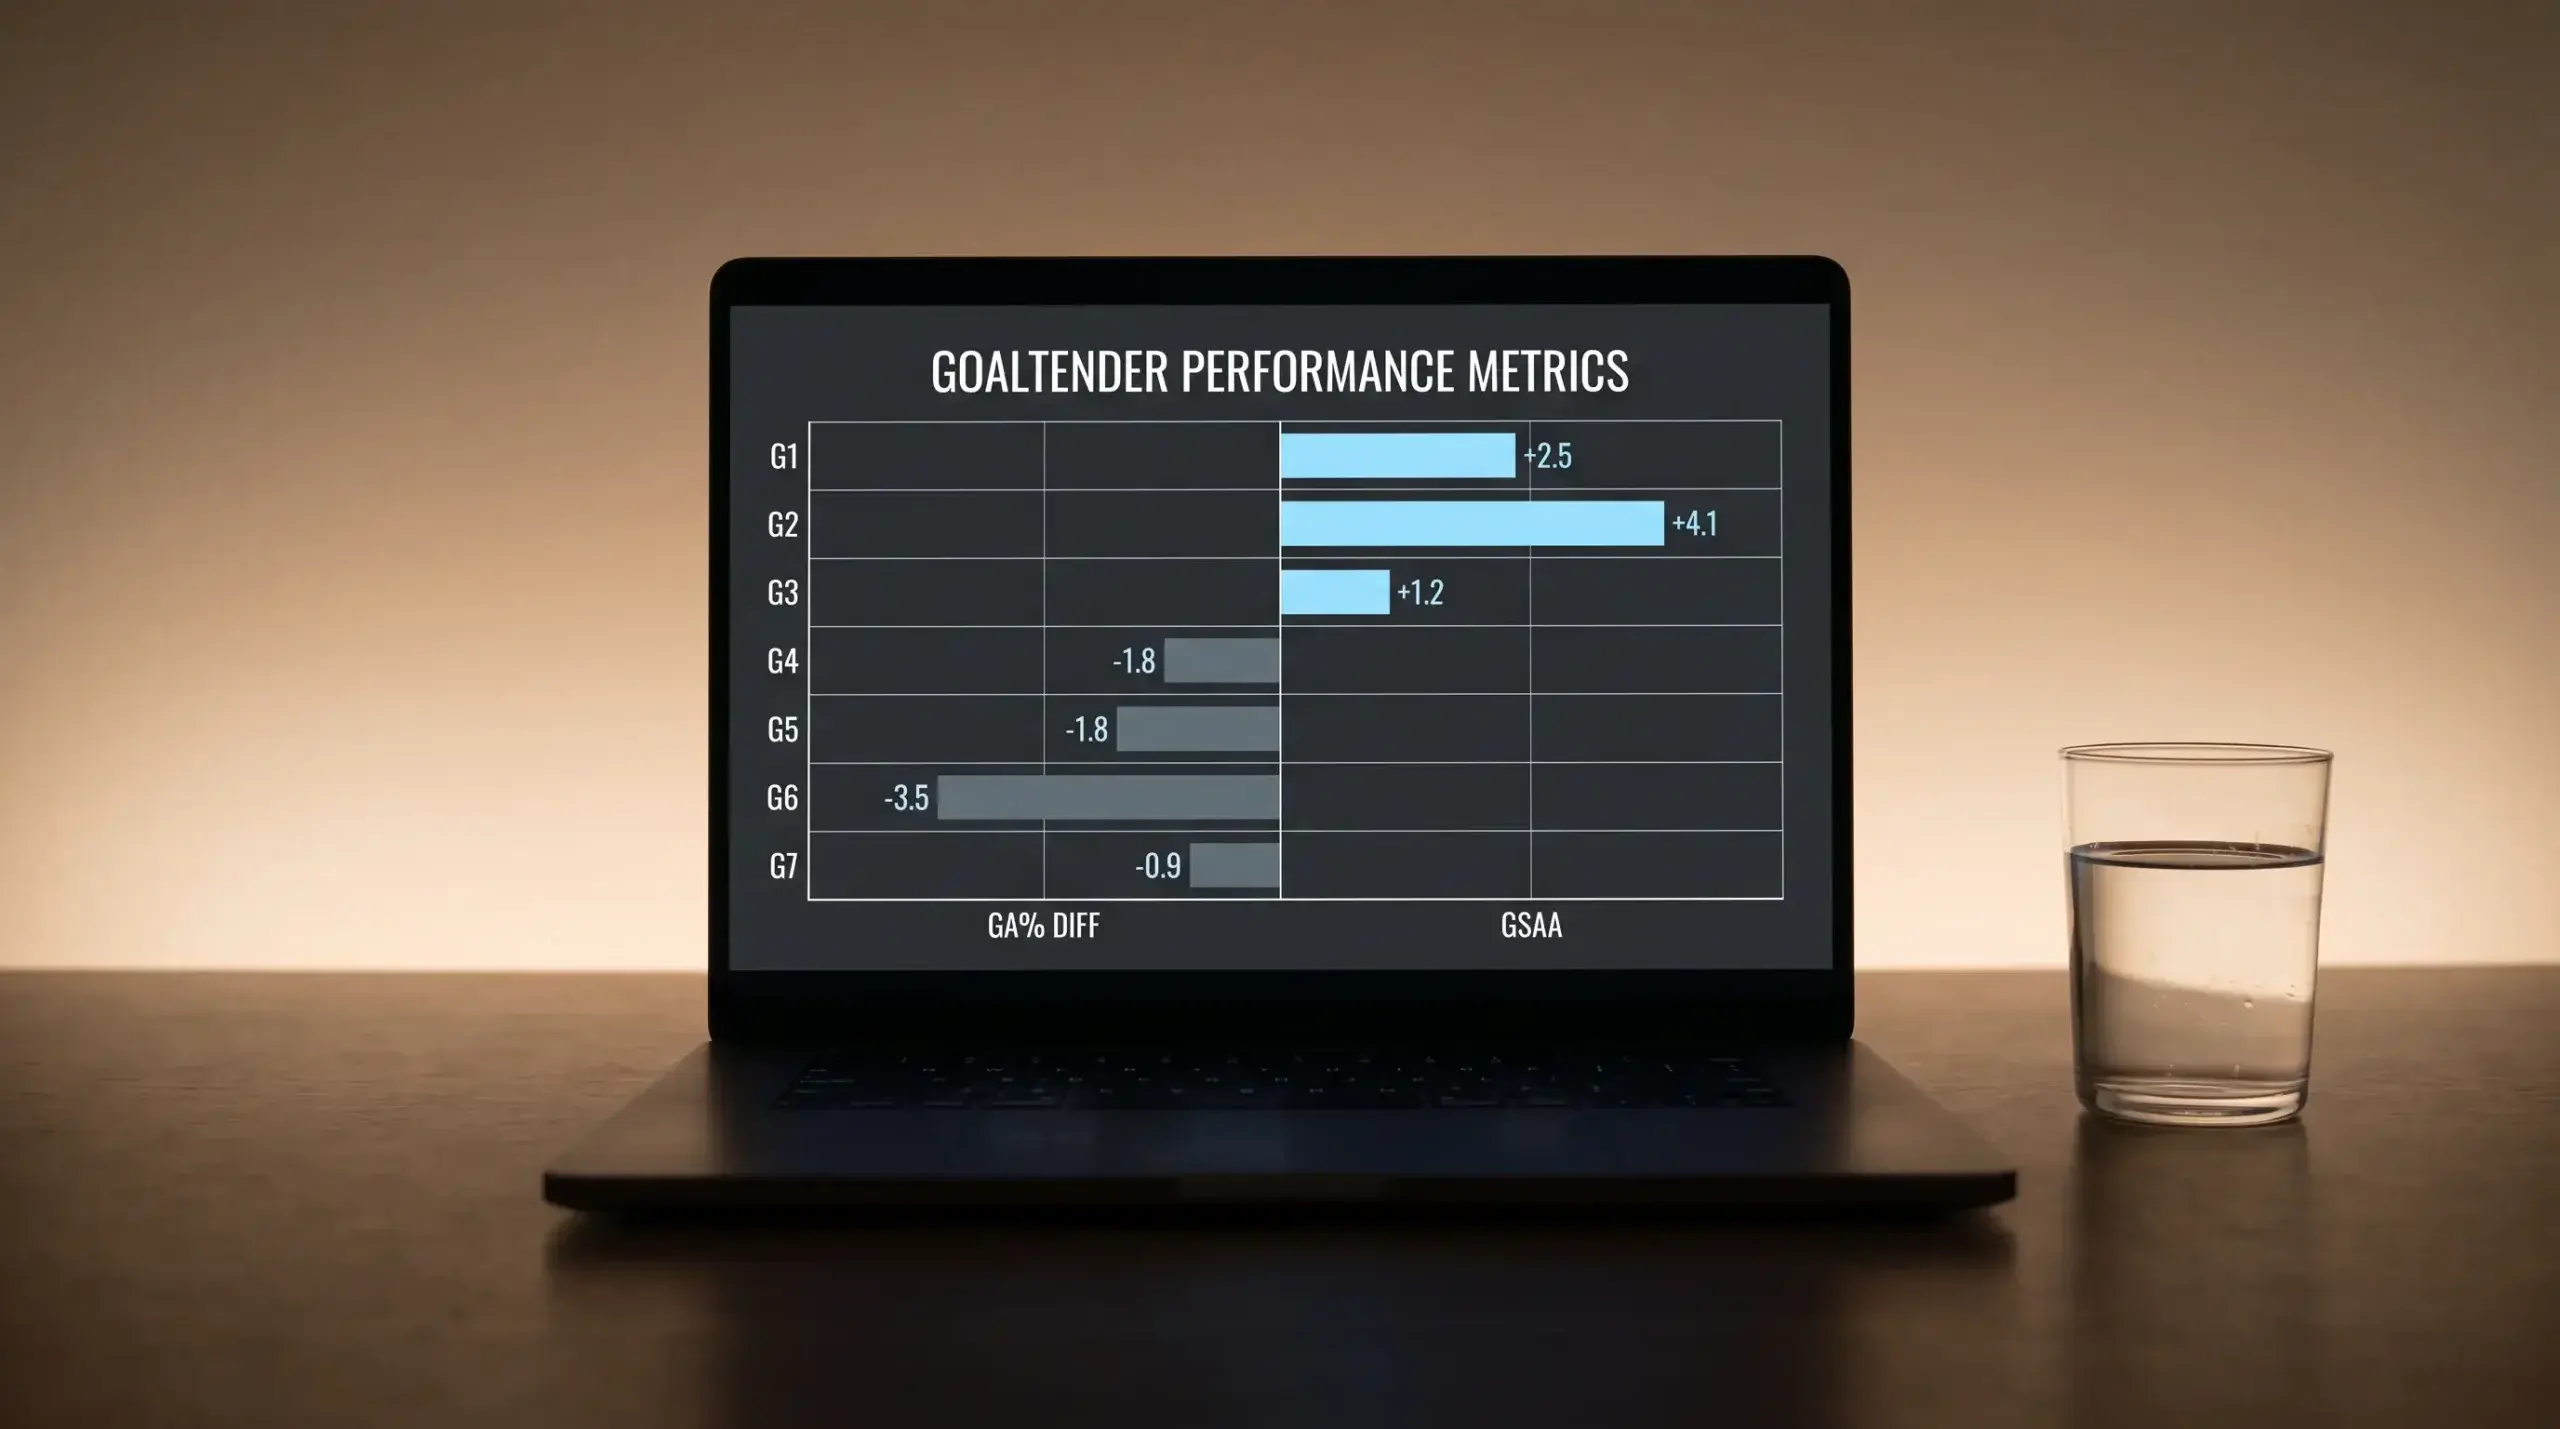
A word of caution: GSAx is cumulative, which means it’s influenced by sample size. A goaltender with a GSAx of +4 after five starts might just be running hot. A goaltender with a GSAx of +15 after forty starts is telling you something real about their ability. I don’t start weighting GSAx heavily in my decisions until a goaltender has at least fifteen starts on the season, and even then I cross-check it against the HDSV% data to make sure the model and reality are pointing in the same direction.
High-Danger Save Percentage
If save percentage is a blunt instrument and GSAx is a scalpel, high-danger save percentage is the X-ray that shows you what’s happening beneath the surface.
High-danger save percentage (HDSV%) isolates a goaltender’s performance on shots from the most threatening areas of the ice — typically the inner slot and the crease area. These are the shots that produce goals at the highest rate, and a goaltender’s ability to stop them is more repeatable and more predictive than their performance on low-danger shots from the perimeter.
Here’s why that matters for bettors: two goaltenders can post identical overall save percentages while being dramatically different in the slot. Goaltender A stops 85% of high-danger chances and 95% of low-danger chances. Goaltender B stops 78% of high-danger chances and 97% of low-danger chances. Their overall save percentage might be within a point of each other, but Goaltender A is far more likely to hold up in high-event games — the playoff-style contests where both teams generate quality chances rather than low-percentage perimeter shots.
I use HDSV% primarily for totals bets. When both starters have elite HDSV% (above 83%), the game is more likely to stay low-scoring even if both teams generate volume. When one or both starters are below 78%, the over becomes attractive regardless of what the team-level defensive metrics suggest. It’s a second layer of filtration that sits on top of GSAx and corrects for situations where the expected goals model and the goaltender’s actual performance on dangerous shots diverge.

The data is available for free on Natural Stat Trick, broken down by game state (even strength, power play, shorthanded) and split by home and away. I focus on even-strength HDSV% because special teams distort the sample — a goaltender facing a five-on-three is in a fundamentally different situation than one facing an even-strength slot shot, and lumping them together muddies the signal.
Workload and Fatigue
Halfway through last season, I noticed a pattern in my losing bets: a disproportionate number involved goaltenders making their third start in four nights. I went back through two seasons of data and found the pattern was real — goaltenders who start three games in a four-night window post a measurably lower save percentage in that third start compared to their season average.
Goaltending is brutally physical. The lateral movement, the butterfly drops, the recovery pushes — all of it takes a toll. And unlike skaters, who get shift breaks every sixty to ninety seconds, the goaltender is on the ice for the entire game. A sixty-minute game with 30 shots faced involves somewhere around 90 to 120 individual save movements, many of them explosive. Do that on consecutive nights and the legs start to go. Do it three times in four nights and the statistical evidence shows up clearly: more goals allowed, more high-danger chances that slip through, more games where the final score doesn’t match the shot quality.
The 2025-26 season was the last with an 82-game schedule; the expansion to 84 games in 2026-27 will put even more pressure on goaltender workload management. Teams already rest their starters more than they did a decade ago, and the best organisations monitor workload carefully. For bettors, this means tracking not just who is starting tonight, but how many games they’ve started in the past week. I flag any goaltender making their third start in five days as a caution, and I won’t back them unless the price already reflects the fatigue risk.

Backup goaltenders, by the way, are not created equal. Some teams carry a genuine 1A/1B split where the backup is competent. Others have a clear number one and a backup who drops the team’s win probability by five to eight percentage points. Knowing the backup’s capabilities — not just the starter’s workload — is part of the same analysis.
Shot volume matters here too. A goaltender who faces 35 shots per game accumulates fatigue faster than one who faces 22 behind a defensive-minded team. I’ve started tracking shots faced per sixty minutes as part of my workload assessment, and the goaltenders who consistently face high shot volumes on short rest are the most likely to underperform their season numbers. It’s an extra data point, but over a long season, the extra data points are what separate a profitable approach from a marginally positive one.
Goalie Confirmation Workflow
The NHL monitors every minute of every game — both on the ice and in the betting lines. Commissioner Gary Bettman has made that point publicly and repeatedly, and for good reason: goaltender confirmation is one of the single biggest line-moving events in hockey. When a starting goaltender is confirmed — or when an unexpected backup is announced — moneylines and totals shift immediately. If you bet before the confirmation and guess wrong, you’re stuck on the wrong side of a line that’s moved against you.
My workflow is rigid. No bet is placed on any NHL game until the starting goaltenders for both teams are confirmed. Period. The confirmation typically comes from morning skate reports, published between 11:30 AM and 1:00 PM Eastern Time — that’s 4:30 PM to 6:00 PM in the UK. Several beat reporters for each team tweet the goaltender first, and dedicated aggregator accounts compile the information within minutes. I follow these sources on a dedicated list so I’m not scrolling through noise to find the confirmation.
On days without morning skates (common during heavy schedule stretches), the confirmation can come later — sometimes as late as 90 minutes before puck drop. When that happens, I have two choices: wait and potentially miss the best line, or pass on the game entirely. I usually wait. The cost of placing a bet with an unconfirmed goaltender is higher than the cost of getting slightly worse odds. I’ve lost more money on goaltender surprises than on any other single factor in my betting career, and I refuse to pay that tax again.
Once both starters are confirmed, I cross-reference against my save percentage, GSAx, and HDSV% data. The whole process — from confirmation to final decision — takes about ten minutes per game. On a typical night with six or seven games, that’s an hour of work. It’s not glamorous. It’s profitable.

Platoon and Tandem Systems
The days of one goaltender playing 65 games are mostly gone. Modern NHL teams increasingly use a tandem or platoon approach, splitting starts between two goaltenders to manage workload and leverage matchups. For bettors, this creates both opportunity and confusion.
Opportunity first. When a team runs a true 1A/1B split — where both goaltenders are capable starters — the bookmaker has to set a line before knowing which goaltender starts. If the market prices the game as though the stronger of the two will play, and the weaker one gets the nod, the line moves in your favour after confirmation. Being first to react to the confirmation — which goes back to the workflow above — lets you capture that movement before the price adjusts.
Confusion comes when bettors don’t understand the system. Some coaches announce their starter early in the week. Others keep it secret until morning skate. A few teams rotate on a strict schedule (one starts at home, the other on the road), while others rotate based on matchup quality or rest. Learning each team’s pattern takes effort, but it pays off because it lets you anticipate who’ll start before the official confirmation and prepare your analysis in advance.
One trend worth flagging: the platoon approach is becoming more common among playoff teams, not just teams managing mediocre goaltenders. Colorado and Dallas, for example, leaned on tandem systems in 2025-26 while remaining contenders. Home teams won 56.6% of NHL games in 2024-25, and part of that advantage comes from the home coach’s ability to control the goaltender matchup through last change — choosing which netminder faces which opposing lineup. In a platoon system, that tactical flexibility is amplified. The implication for futures and series bets is significant — in the playoffs, most teams ride their number one. A team that thrived with a tandem during the regular season might struggle when their backup sits for weeks. Factor this into your playoff analysis before assuming regular-season performance will carry over.