


Totals betting is where I cut my teeth. Before I understood Corsi differentials or goaltender save metrics, I could look at two teams and make a reasonable call on whether the game would produce a lot of goals. That instinct has been refined by eight years of data, but the core principle has not changed: totals markets are the most forgiving entry point for NHL bettors who do their homework, and the most punishing for those who rely on gut feel alone.
The most common total line in the NHL is 6.5 goals. That single number dominates the market and creates a binary decision that feels deceptively simple — over or under. In the 2025-26 season, games went over the posted total 52.9% of the time, a subtle but exploitable lean toward the over. That figure does not hand you free money, but it does tell you where the market’s centre of gravity sits and how to position around it.
How Totals Are Set
I once asked a former odds compiler how he set NHL totals, and his answer surprised me: “We start with the goalies and work backward.” That process flips the way most bettors think. Punters look at offensive firepower first — which teams score the most, who has the hot power play. Bookmakers look at who is stopping the puck.

The opening total typically begins with each team’s expected goals per game averaged together, adjusted for home-ice effects, rest, and the confirmed goaltending matchup. If both starters carry save percentages above .920, the total drops. If one team is rolling out a backup with a sub-.900 save rate, it creeps up. The 6.5 line acts as a magnet because the league-wide scoring average hovers near 6.2 to 6.5 goals per game in most seasons, making 6.5 the natural pivot. Bookmakers rarely move to 5.5 or 7.5 unless the matchup is extreme.

The price on each side of 6.5 is where the real action happens. An over at 1.87 versus an over at 2.00 reflects a meaningful shift in the book’s assessment. I track these prices across three UK bookmakers before every game I consider, because a 10-pence difference in odds translates to a dramatically different expected value over a full season.
Scoring Trends in the 2025-26 Season
Something unusual happened this season — and it caught plenty of bettors off guard. The league-wide save percentage dropped to 89.6%, falling below the 90% threshold for the first time since 1993-94. That decline is not a blip. It reflects rule enforcement changes, lighter goaltender equipment, and a generation of skaters who shoot with more velocity and accuracy than any before them.

Keith Wachtel, the NHL’s president of business, noted that the sportsbook handle continues to grow and the rising tide is lifting all boats. That growth in betting volume matters for totals because more money flowing into the market means tighter lines and fewer soft numbers. When the league was a niche betting product, you could find 6.5 totals mispriced by half a goal’s worth of value. Now the efficiency has tightened, which means your edge has to come from information rather than market inefficiency.
The practical impact of the save percentage decline is straightforward: unders are harder to hit than they were two seasons ago. I have shifted my seasonal base rate expectation accordingly. Where I once treated 6.5 as a coin-flip line, I now approach it with a mild over bias and need stronger evidence to take an under. Jesper Wallstedt led the league with a .936 save percentage, but he is the outlier. The average starter sits closer to .900, which means more goals are leaking through on both sides of every game.
Situational Factors That Shift Totals Value
Raw scoring averages only get you halfway. The rest of the work is situational, and I have found three factors that move the needle more than any others.
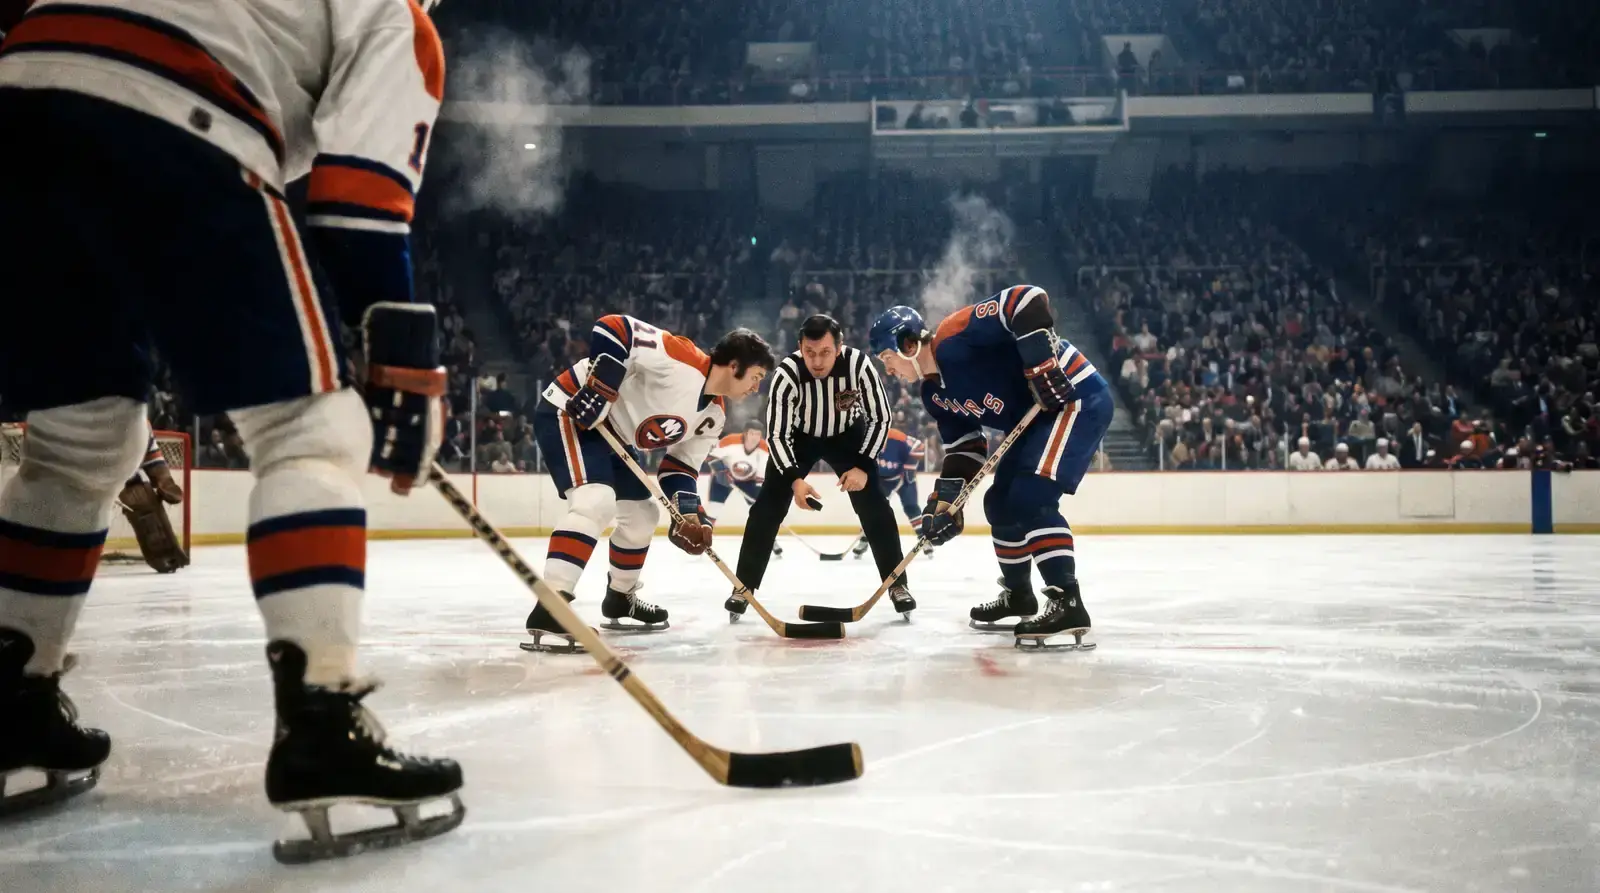
First, home-ice advantage compresses totals in ways that are not immediately obvious. Home teams won 56.6% of games in 2024-25, but the mechanism matters for totals: home teams tend to control pace, which can either inflate or suppress scoring depending on their style. A possession-heavy home team like Minnesota will slow the game down, pushing toward the under. A high-event home team like Florida will open things up. I never bet a total without first checking whether the home team plays a pace that aligns with my lean.
Second, back-to-back scheduling creates fatigue asymmetries that inflate totals. When one team is on the second night of a back-to-back and typically deploys a backup goaltender, the expected goals against for that team spike. If the opposing team is rested and starting their number-one netminder, the total becomes lopsided — one side of the game might produce three or four goals while the other side stays quiet. Those games often clear the over on the strength of one team’s performance alone.
Third, late-season games between eliminated teams and playoff-bound teams are under gold mines. The eliminated team mails it in defensively, but the playoff team often rests key players or coasts through the third period with a lead. The result is a low-intensity, low-event game that slips under more often than the market expects. I lean under in these matchups from mid-March onward, particularly when the total is set at 6.5 or above.
Building a Totals Betting Process
My daily routine for totals starts the same way every morning. I pull up the confirmed goaltender matchups, check each starter’s rolling ten-game save percentage, and compare it to the season number. If a goalie with a .915 season average has posted .895 over his last ten starts, the market may not have fully adjusted — that is an over signal. The reverse applies for a cold goalie who suddenly posts .925 across his recent starts.

I cross-reference that with expected goals data. If both teams are generating high xG numbers but their goalies have been outperforming expectation, a regression-driven over play emerges. If both teams are producing low xG and their goalies are performing at or below expected, the under case strengthens. The point is to triangulate: goaltender form, team-level shot generation, and situational context should all point the same direction before I commit a stake.
Totals betting rewards patience more than any other NHL market. The variance is lower than the moneyline, the information advantage is more accessible, and the emotional noise of rooting for a team to win is absent. You are simply betting on the shape of the game, and that analytical distance is an edge in itself.
