

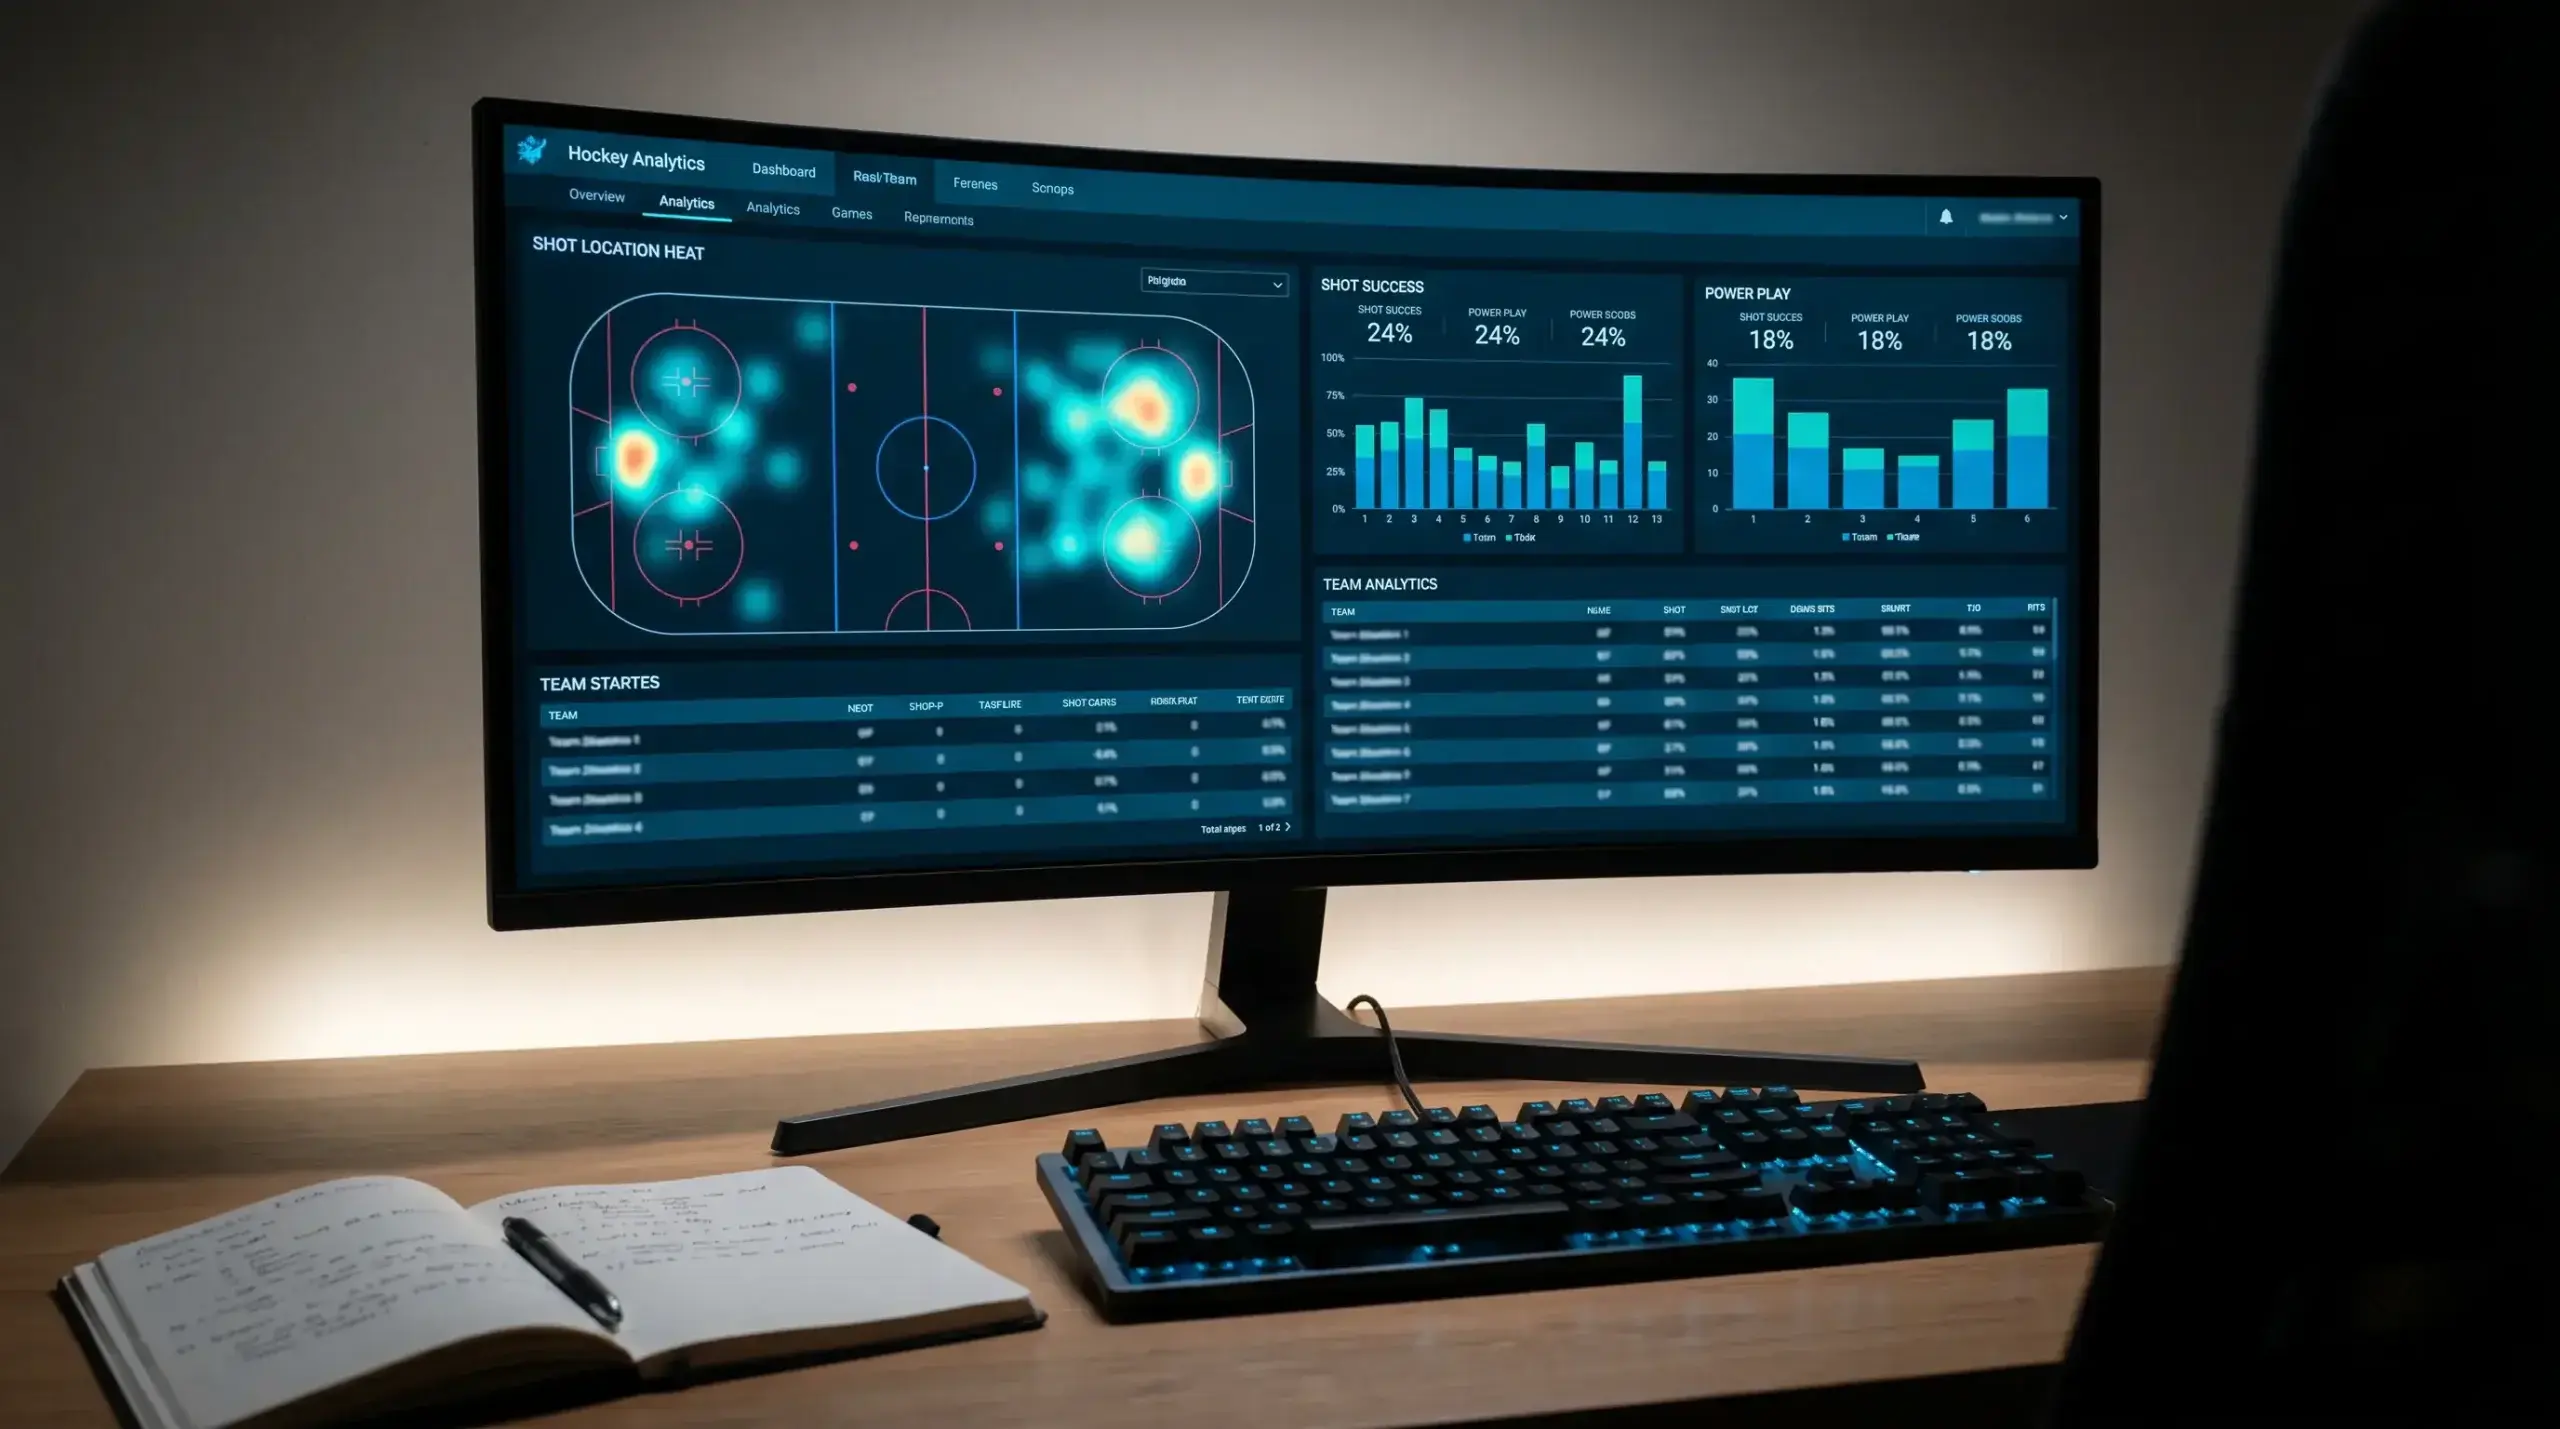
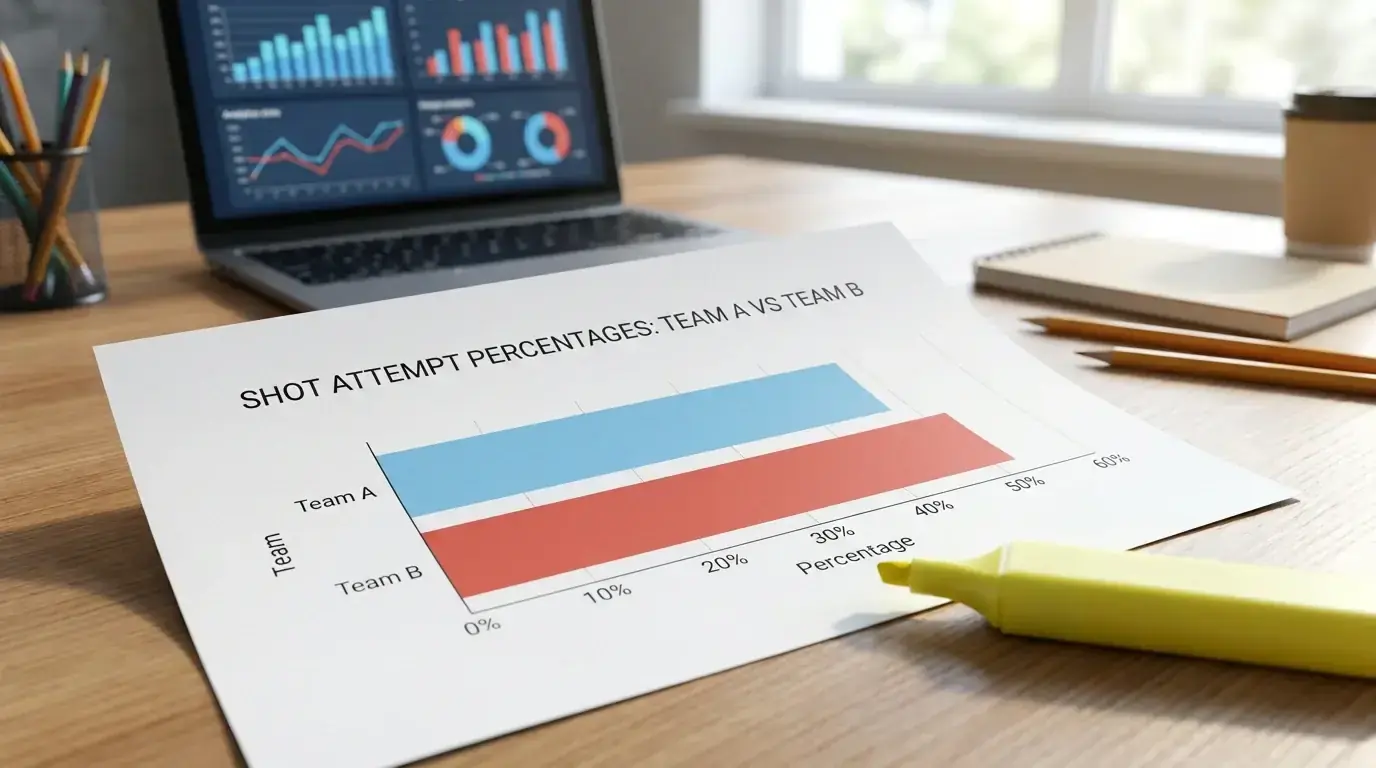
I remember the exact moment NHL analytics clicked for me. I was staring at a game recap where Team A outshot Team B 38-21 but lost 3-2. The casual interpretation: Team A got unlucky. The analytical interpretation: what kind of shots were they? Where were they taken from? How many were high-danger? When I pulled the expected goals data, it turned out Team A’s 38 shots generated just 1.8 xG — mostly harmless perimeter attempts — while Team B’s 21 shots generated 2.9 xG from the slot and the crease. Team B didn’t win by luck. They won because they were better at the things that actually produce goals.
That’s the fundamental promise of NHL advanced analytics for betting: they measure what matters rather than what’s visible. The most common total line in the NHL is 6.5 goals, and whether a game goes over or under that number depends far more on shot quality than shot quantity. Advanced metrics give you the tools to assess quality before the game starts, compare your assessment to the bookmaker’s price, and act when there’s a gap. This guide walks through the full pipeline: what data to collect, how to process it, and how to convert the output into wagers.
The Data Pipeline: From Collection to Decision
Before I started using analytics seriously, my pre-game research was a mess. I’d read three previews, check the standings, glance at some stats, and make a gut call. The information I consumed had no structure. There was no pipeline — just a jumble of inputs feeding an intuition that was right about as often as a coin flip.
The pipeline I use now has four stages, and each one feeds the next. Stage one is data collection: I pull team-level and goaltender-level metrics from free sources (which I’ll cover later in this guide). The metrics I care about are Corsi, Fenwick, expected goals (xG), actual goals, save percentage, high-danger save percentage (HDSV%), and GSAx. I pull these for both teams in a matchup, filtering for five-on-five play only — special teams distort the numbers in ways that make comparisons unreliable.
Stage two is contextual adjustment. Raw numbers need context. A team’s Corsi might look dominant, but if most of their games have been against bottom-tier opponents, the number is inflated. I adjust for strength of schedule by weighting recent opponents’ quality, and I adjust for venue by checking home/away splits — home teams in the NHL won 56.6% of games in 2024-25, and the split affects both shooting and save metrics.
Stage three is comparison. I line up both teams’ adjusted metrics side by side and identify where the biggest gaps are. If Team A generates significantly more expected goals at five-on-five than Team B allows, that’s a signal. If Team A’s goaltender has a GSAx of +12 while Team B’s is at -3, that’s another signal. The signals don’t tell me who wins — they tell me where the probabilities lean and by how much.
Stage four is market pricing. I convert my probability estimate into a fair odds number and compare it to the bookmaker’s price. If my estimate says 52% and the bookmaker’s implied probability is 44%, I have value. If my estimate says 52% and the bookmaker implies 55%, I don’t. No bet. The discipline to skip games where the edge isn’t there is what makes this a system rather than a hobby.
Possession Metrics in Practice
The sports betting handle keeps growing — every year, more money flows into NHL markets, and every year, the pool of sophisticated bettors competing for the same edges gets deeper. Possession metrics — Corsi and Fenwick — remain the entry point for analytical NHL bettors, but using them well requires more than knowing the definitions.
Corsi counts all shot attempts: goals, saves, misses, and blocks. It’s expressed as a percentage — a team with a 54% Corsi generates 54% of all shot attempts when they’re on the ice at five-on-five. Fenwick is similar but excludes blocked shots, on the logic that blocked shots reflect the defending team’s strategy rather than the shooting team’s pressure. Both metrics are proxies for puck possession: if you’re attempting more shots, you probably have the puck more often.
Where most people go wrong is treating Corsi or Fenwick as a standalone predictor. A team with a 56% Corsi isn’t automatically a good bet. What matters is the gap between their possession dominance and the bookmaker’s pricing. If a 56% Corsi team is priced as a favourite at 1.55, the market may already reflect their possession advantage, and there’s no value. If the same team is priced at 1.85 because they’ve had poor results recently despite controlling play, the possession data suggests the market is underreacting to process and overreacting to outcomes. That’s where the bet lives.
I apply Corsi and Fenwick as a first-pass filter. Teams with a Corsi above 52% at five-on-five go on my “consider backing” list. Teams below 47% go on my “consider fading” list. Everything in between is noise that I ignore unless other metrics (goaltending, schedule) provide a stronger signal. This filter eliminates roughly half the games on a given night, which is the point — you can’t bet everything, and the filter forces you to focus on the spots with the highest analytical confidence.
One subtlety worth noting: Corsi and Fenwick are team-level metrics, but team composition changes throughout the season due to injuries, trades, and call-ups. A team’s Corsi in November with a full healthy roster isn’t comparable to their Corsi in March with two top-six forwards on injured reserve. I track a team’s rolling Corsi over the most recent fifteen games rather than the full season, specifically to capture these roster-driven shifts. The full-season number is useful for identifying a team’s baseline; the rolling number tells you where they are right now.
The Expected Goals Model
If Corsi measures quantity, expected goals measures quality. And in a league where the average save percentage just dropped below 90% for the first time in three decades, shot quality has never mattered more.
Expected goals (xG) assigns a probability to every shot based on where it was taken, the shot type, whether it followed a rebound, whether it came off a rush, the angle to the net, and sometimes additional factors like shooter talent. A wrist shot from the point might carry an xG of 0.02 (a 2% chance of scoring). A one-timer from the low slot might carry 0.35. Sum up all the xG values for a game and you get a team’s total expected goals — the number of goals an average team would score given those exact shot opportunities.
The power of xG for betting lies in the gap between expected and actual goals. A team that generates 3.2 xG per game but only scores 2.4 actual goals is underperforming its process — running cold, getting unlucky, or both. Over time, actual goals tend to regress toward expected goals. If the bookmaker is pricing that team based on their actual scoring output rather than their underlying shot quality, you’ve found a team the market undervalues. The reverse is equally true: a team scoring 3.5 actual goals on 2.6 xG is overperforming and likely to regress downward, making them a candidate to fade.
I run this analysis on a rolling twenty-game window rather than the full season. Early-season data is noisy and roster changes mid-year can shift a team’s profile overnight. A twenty-game window balances stability with responsiveness — long enough to smooth out single-game variance, short enough to capture genuine shifts in team quality. For a more detailed look at how xG models work and how to use them for totals bets specifically, I’ve written a separate guide on expected goals in NHL betting.
The most common total line in the NHL sits at 6.5, and that number is where xG becomes particularly actionable. If both teams in a matchup have rolling xG-for above 3.0 and their goaltenders are posting below-average HDSV%, the over at 6.5 becomes attractive. If both teams generate below 2.3 xG per game and their goaltenders are elite, the under has structural support. The numbers don’t guarantee the outcome — hockey is too random for guarantees — but they stack the probability in your favour across a season of bets.
Filtering the Noise
Data is only useful if it’s clean. And NHL data, particularly in small samples, is extremely noisy. I’ve learned this the hard way — repeatedly.
The biggest source of noise is sample size. A team’s Corsi after five games tells you almost nothing about their true quality. After fifteen games, the signal starts to emerge. After thirty, you’re working with data you can trust. I don’t weight any possession or expected goals metric heavily until a team has played at least twenty games, and even then I cross-check against the eye test by watching condensed game highlights for the teams I’m betting on. The numbers should match what you see on the ice. If they don’t, something is off — either the data has a blind spot or you’re misinterpreting it.
Score effects are another noise source. When a team is trailing by two goals in the third period, they throw everything at the net. Their shot volume and Corsi spike — not because they’re suddenly dominating, but because the trailing team plays recklessly and the leading team sits back. If you don’t filter for game state, you’ll systematically overrate losing teams and underrate winning ones. I use score-adjusted Corsi (sometimes called score-close Corsi) that includes only five-on-five play when the score is within one goal, and the difference in signal quality is dramatic.
Venue effects matter too. Home teams consistently generate higher Corsi than their road averages, partly because of last change (the home coach gets to match lines more favourably) and partly because of scorer bias (home arenas tend to be slightly more generous in crediting shots). I don’t adjust the raw numbers — I simply flag when a team’s strong Corsi is disproportionately driven by home games and temper my expectations when they play on the road.
Finally, there’s the question of which model to trust. MoneyPuck, Evolving-Hockey, Natural Stat Trick, and HockeyViz all use slightly different xG models with different inputs and weightings. No single model is “correct.” I use MoneyPuck as my primary source and cross-reference with Evolving-Hockey when the two diverge significantly. If both models agree that a team is undervalued, I have higher confidence. If they disagree, I stay cautious.

From Model to Wager: The Decision Workflow
Analytics can tell you which team is undervalued. They can’t place the bet. The gap between analysis and action is where most analytically inclined bettors lose their way — they get stuck in data, tweaking models and adding variables, and never actually pull the trigger.
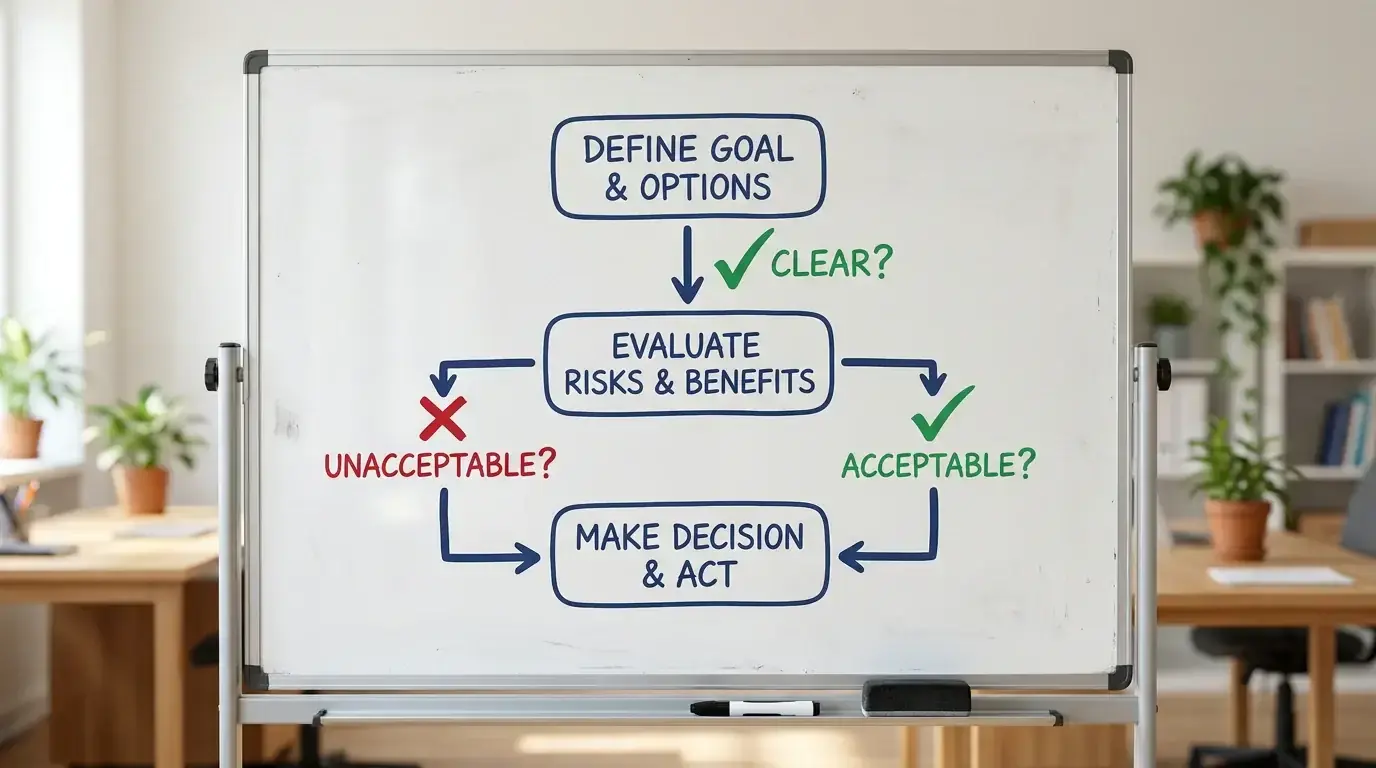
My decision workflow has three gates. Gate one: does the analytical picture show a clear edge? I need at least two metrics (typically Corsi/Fenwick and xG) pointing in the same direction, plus a goaltending edge or at minimum a neutral matchup. If only one metric supports the bet, I pass. Gate two: does the bookmaker’s price understate the probability I’ve estimated? I need a gap of at least four percentage points between my implied probability and the bookmaker’s implied probability. Less than four points isn’t worth the juice. Gate three: is there a structural reason the market might be wrong? Underdogs won 39.1% of NHL games in 2024-25 — second only to baseball. The market systematically overvalues favourites, which means the structural lean should support underdog bets more often than favourite bets. If my analysis points toward a favourite, I need the edge to be larger to compensate for the structural headwind.
This entire approach depends on the integrity of the market itself. Bettman has made it clear that integrity remains paramount to the NHL — the league signed agreements with the CFTC specifically to strengthen its monitoring systems. That matters for data-driven bettors because a clean market means the odds reflect genuine information rather than manipulation. Your analytical edge is only worth something if the market is honest enough for edge to exist.
When all three gates clear, I place a flat-unit bet. No overthinking the size. No doubling up because “this one feels like a lock.” The system works because it’s consistent, not because any individual bet is a sure thing. Over the past three seasons, this workflow has produced a positive ROI — not a spectacular one, but a steady one that compounds across hundreds of bets.
The workflow also tells me what not to bet. If the analytics are ambiguous, or the price is fair, or the structural lean works against me, the answer is no. I skip more games than I bet on most nights, and those skips are as much a part of the strategy as the bets themselves.
One practical example to illustrate the full workflow: in a recent matchup, Team A was a home underdog at 2.30. Their rolling twenty-game Corsi was 53.4%, their xG-for per sixty was 2.95, and their starter had a GSAx of +8. Team B’s rolling Corsi was 49.1%, their xG-against per sixty was 3.10, and their goaltender had a GSAx of -4. The schedule was neutral — both teams had two days’ rest. My model estimated Team A’s win probability at 49%. The bookmaker’s price implied 43%. That six-point gap cleared gate two. The home underdog angle cleared gate three. All three gates: bet placed, flat unit. Team A won 3-1. But the outcome wasn’t the point — the process was. The next time this setup appears and Team A loses 2-3, the bet was still correct. That’s the mindset you need to sustain a data-driven approach over hundreds of games.
Free Data Sources
You don’t need to pay for data to build an analytical NHL betting process. Everything I use is freely available, and the quality of free NHL analytics is, in all honesty, better than what’s available for most other sports.
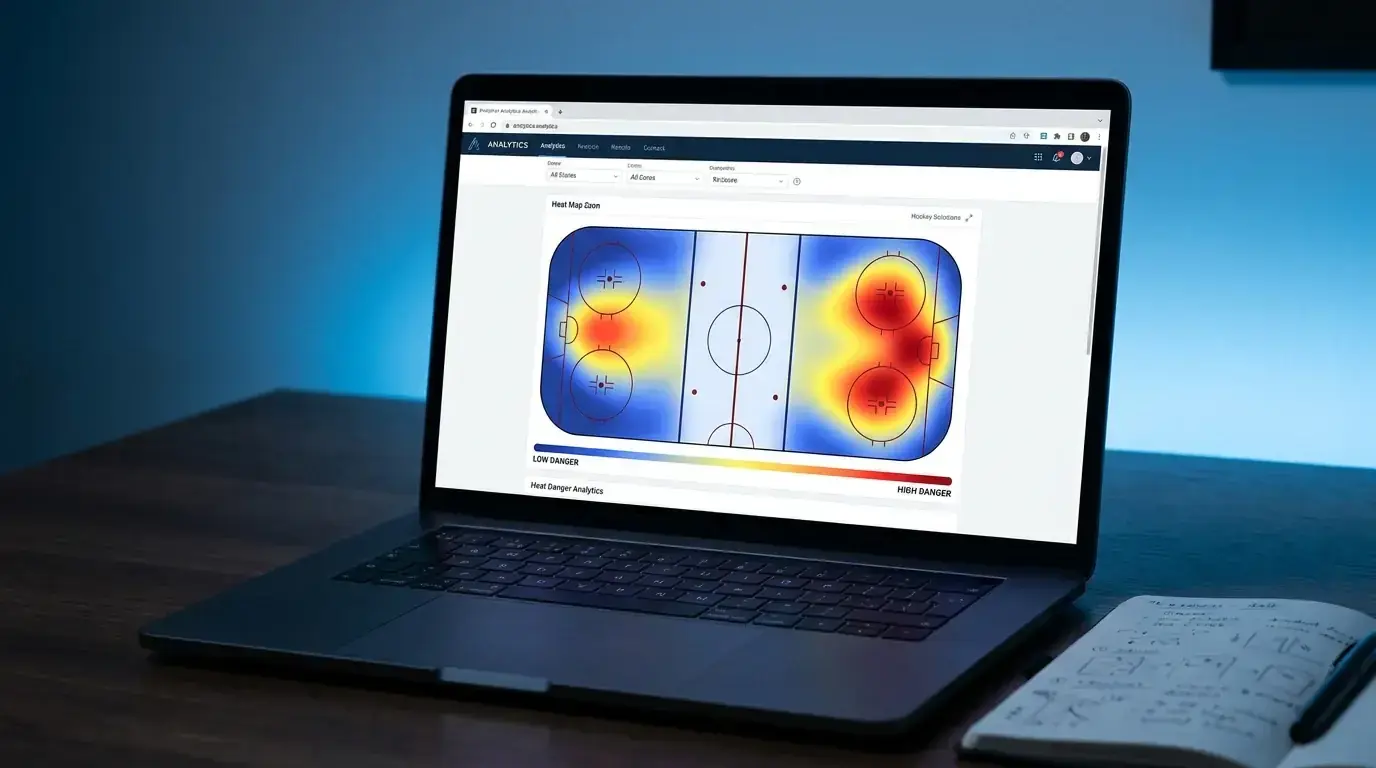
MoneyPuck is my primary source for expected goals, Corsi, Fenwick, and team-level analytics. The site updates daily during the season and offers downloadable data for anyone who wants to build their own models. Evolving-Hockey provides player-level and goaltender-level advanced stats including GSAx, HDSV%, and score-adjusted possession metrics. Natural Stat Trick is the deepest source for granular game-state filtering — you can isolate five-on-five, close-score, home/away, and time-period splits with a few clicks. HockeyViz offers heat maps and visual representations of shot data that are useful for quickly identifying where a team generates its chances.
For schedule data, I use the NHL’s official site to pull upcoming dates, back-to-back flags, and travel distance. Beat reporters on social media remain the fastest source for goaltender confirmations, lineup changes, and injury updates that aren’t reflected in official channels until game time.
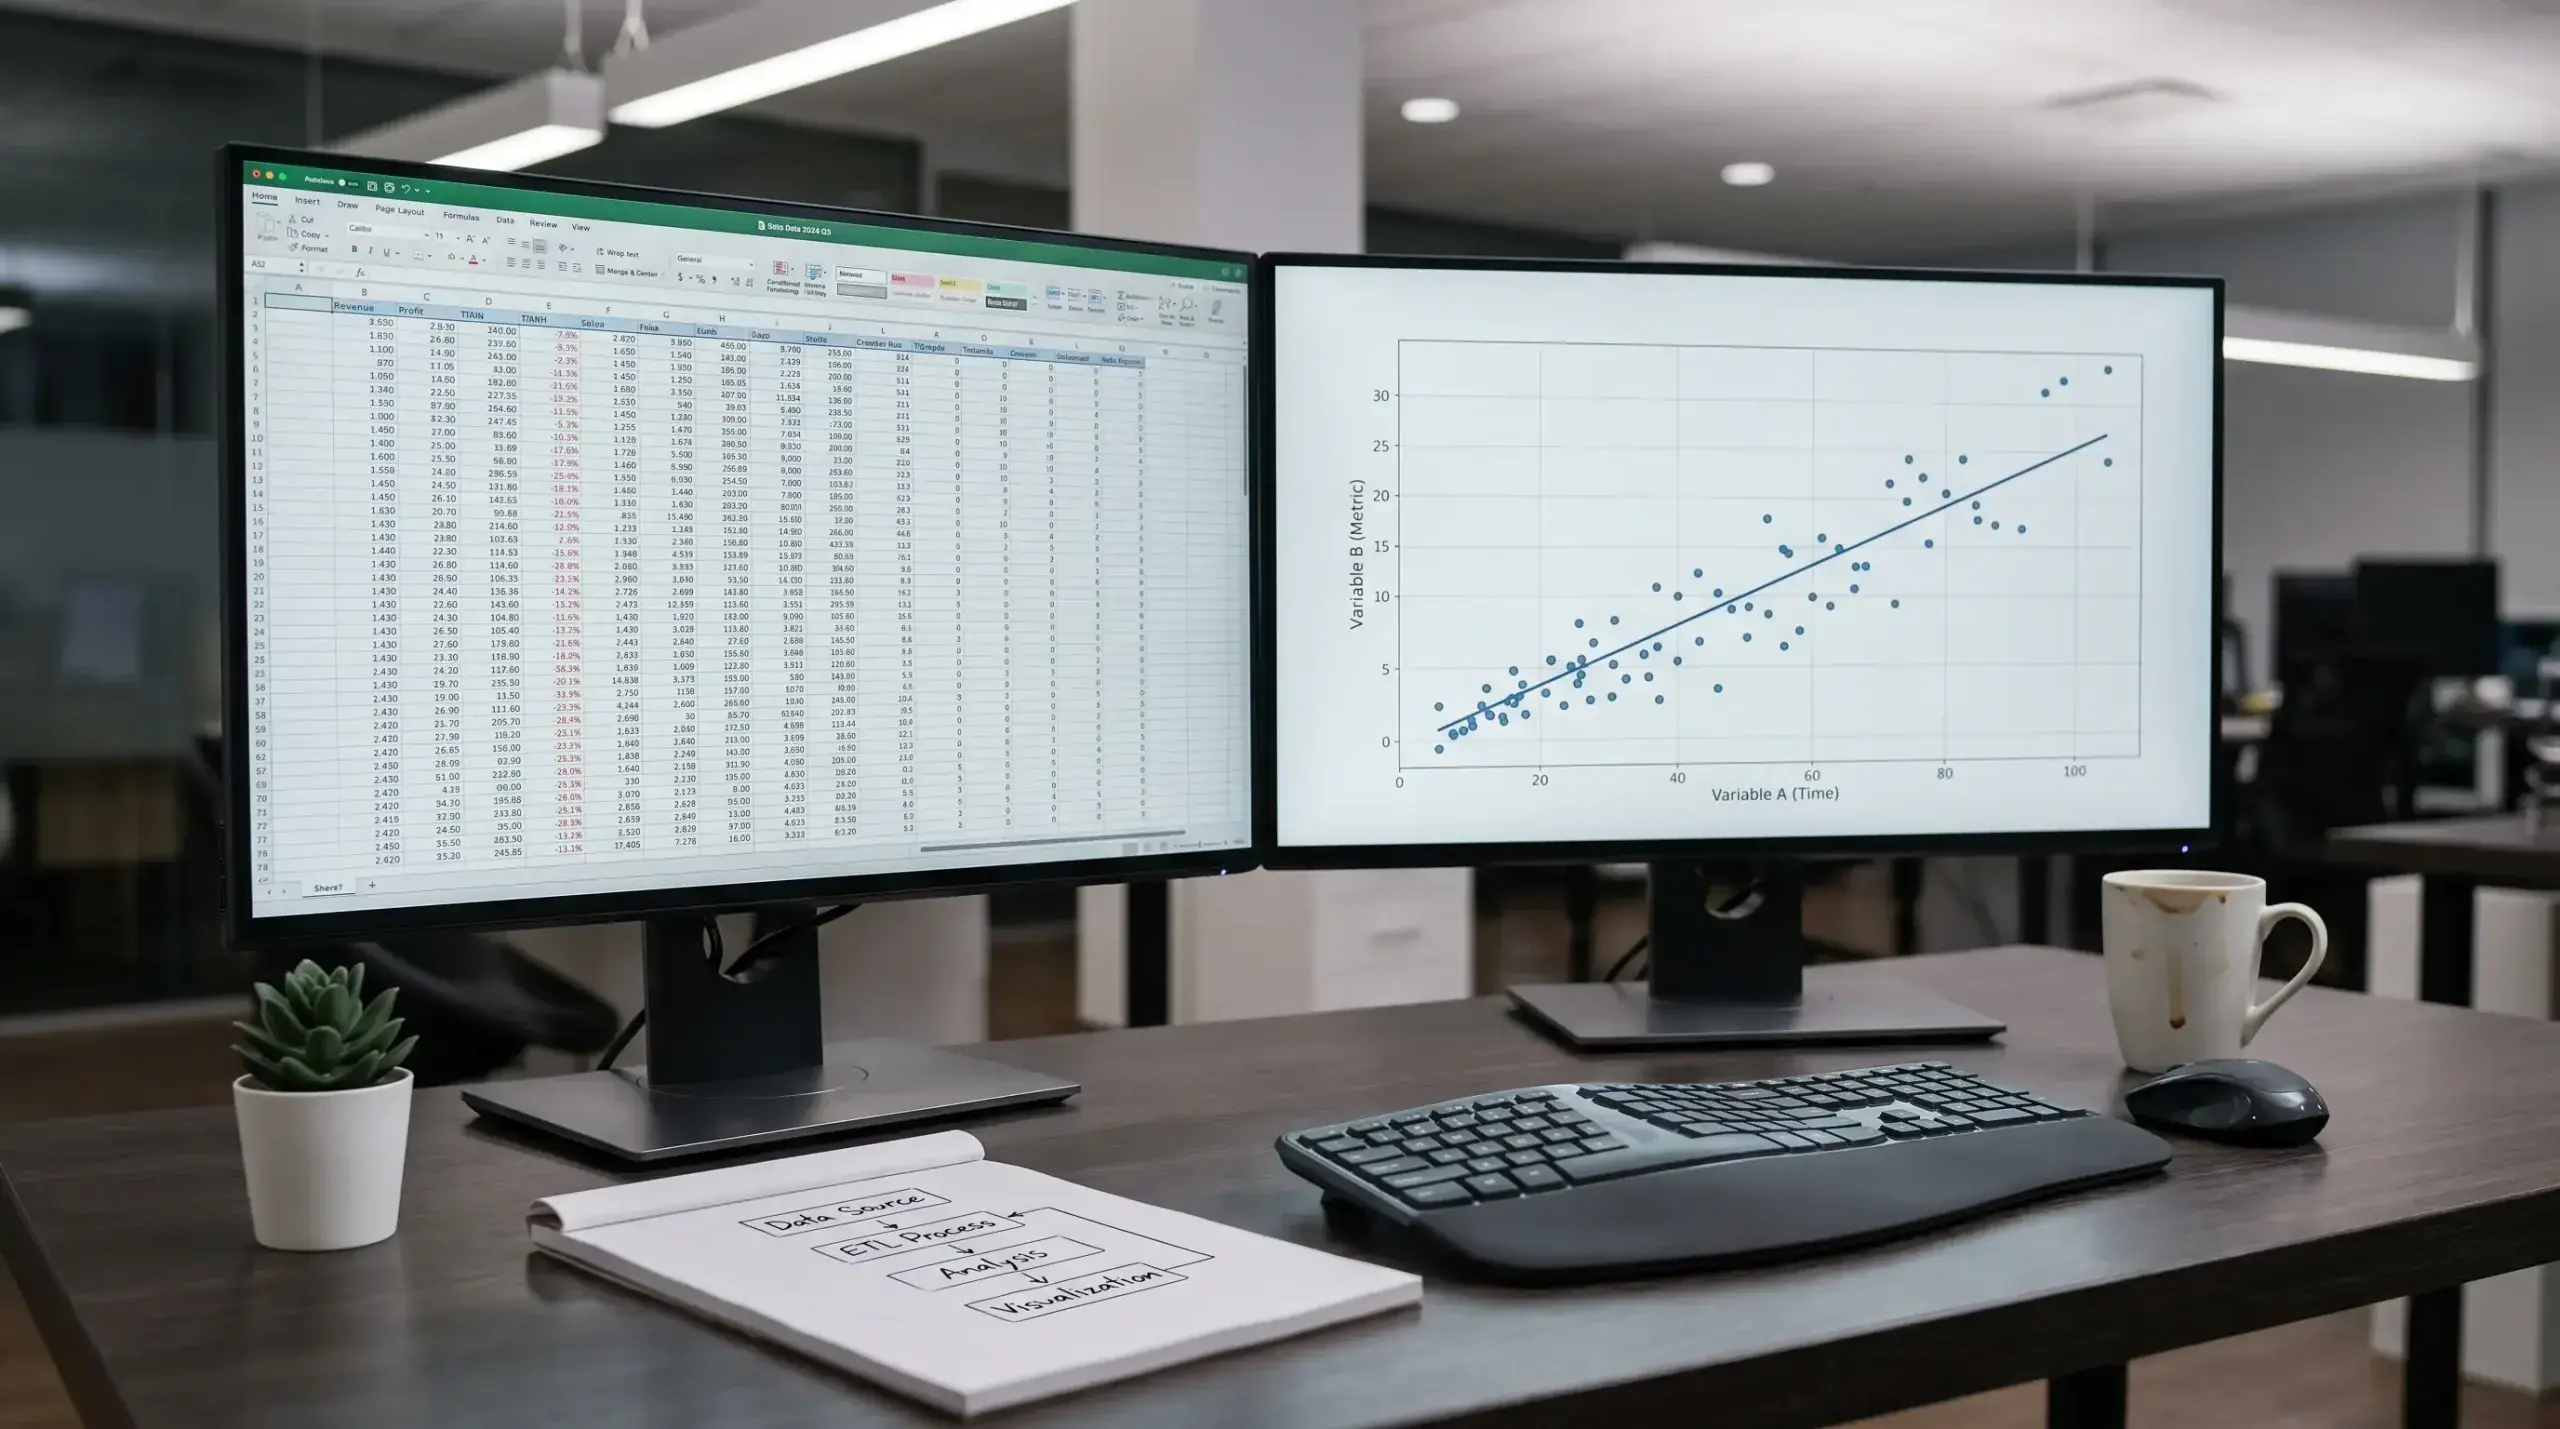
I also maintain a simple spreadsheet where I log my daily outputs: the adjusted metrics for each team in the games I’m considering, my probability estimate, the bookmaker’s price, and the decision (bet or pass). This log serves two purposes. First, it forces discipline — writing down your analysis before placing the bet prevents post-hoc rationalisation. Second, it creates a dataset for evaluating your own process over time. After two hundred logged games, you can see whether your probability estimates are calibrated (do the games you rate as 55% probabilities actually win about 55% of the time?) and which filters contribute the most to your profitability. That calibration feedback loop is, ultimately, the most valuable data source of all — it’s yours, it’s specific to your process, and no one else has it.

The trap with free data is abundance. You can spend hours drilling into matchup-specific micro-splits that look meaningful but are actually noise. My rule: if a data point requires more than twenty games of sample to be meaningful and the sample I have is smaller than that, I ignore it. More data isn’t better data. Relevant data, in sufficient quantity, is better data. Learning to discard the noise is harder than learning to use the signal, and it’s the skill that ultimately determines whether analytics sharpen your betting or just make you slower at placing bets.
