


I spent two full seasons ignoring home-ice advantage in my NHL models. My reasoning was that modern athletes, with their charter flights and sports science, had erased whatever edge a home crowd once provided. The data humbled me thoroughly. Home teams in the NHL won 56.6% of all matches in 2024-25, a gap of 13.2 percentage points over visitors — one of the most persistent edges in professional sport. I was not wrong that travel has improved, but I was wrong to assume that eliminated the advantage. The cause is more complex than crowd noise, and understanding what drives it is essential for any bettor who wants to price games accurately.
Home Win Rate Breakdown
Let me walk through the numbers that reshaped my approach. In 2024-25, home teams won 54.2% of games on the moneyline. That figure includes overtime and shootout results, which compress the gap slightly because the extra frame is essentially a coin flip. In regulation time only, the home advantage is even more pronounced.

The 13.2 percentage-point gap between home and away win rates has held remarkably steady across the past decade. Compare that to the Premier League, where home advantage has been eroding since the early 2010s and dropped further during the crowd-free pandemic seasons. The NHL’s advantage remains robust, and the reasons are partly structural: the home team gets last change on faceoffs, allowing coaches to deploy favourable matchups against the opposition’s top lines. That tactical lever does not exist in most other sports.
Travel is the other structural factor. NHL teams cross up to three time zones during road trips, and the schedule compresses games into clusters. A Western Conference team visiting the Eastern Conference for a four-game swing faces jet lag, unfamiliar ice, and often back-to-back scheduling. The data on first-game-of-trip results versus third-game-of-trip results shows a decline in road team performance that accelerates with distance and duration. For UK bettors, this is actionable intelligence: filter your moneyline bets by whether the road team is early or late in a trip, and the home-ice edge becomes more or less powerful accordingly.
Home-Away Splits by Odds Range
Not all home advantages are created equal. I segment my data by the odds range the home team is priced at, and the results reveal where the market gets it right and where it slips.

Home favourites priced between 1.50 and 1.70 win at a rate that roughly matches their implied probability — the market is efficient here because these matchups attract the most betting volume and the sharpest money. Home favourites priced shorter than 1.40 actually underperform expectation, largely because the massive juice attracts public money that inflates the line beyond what the true probability supports. Meanwhile, home underdogs — priced at 2.20 or above — are where the edge widens. They won 44.4% of games in the 2024-25 season, yet their odds frequently implied a win probability of 35-38%. That 6-9 percentage-point discrepancy represents consistent, exploitable value.
The against-the-spread numbers reinforce this. Home underdogs covered at 63.9%, while home favourites covered at just 41.8%. For a deeper look at how to build a strategy specifically around underdog value, the data points to the home underdog as the single most reliable situational play in the NHL. I allocate a disproportionate share of my bankroll to this segment precisely because the numbers have been stable year after year.

Venue-Specific Factors
Beyond the league-wide averages, individual arenas have quirks that influence outcomes in ways the generic model misses. Altitude is the obvious one: Denver’s Ball Arena sits at over 1,600 metres above sea level, and visiting teams consistently underperform there compared to other road games. The thin air affects skating endurance and puck behaviour, and Colorado’s roster is conditioned for it while opponents are not.
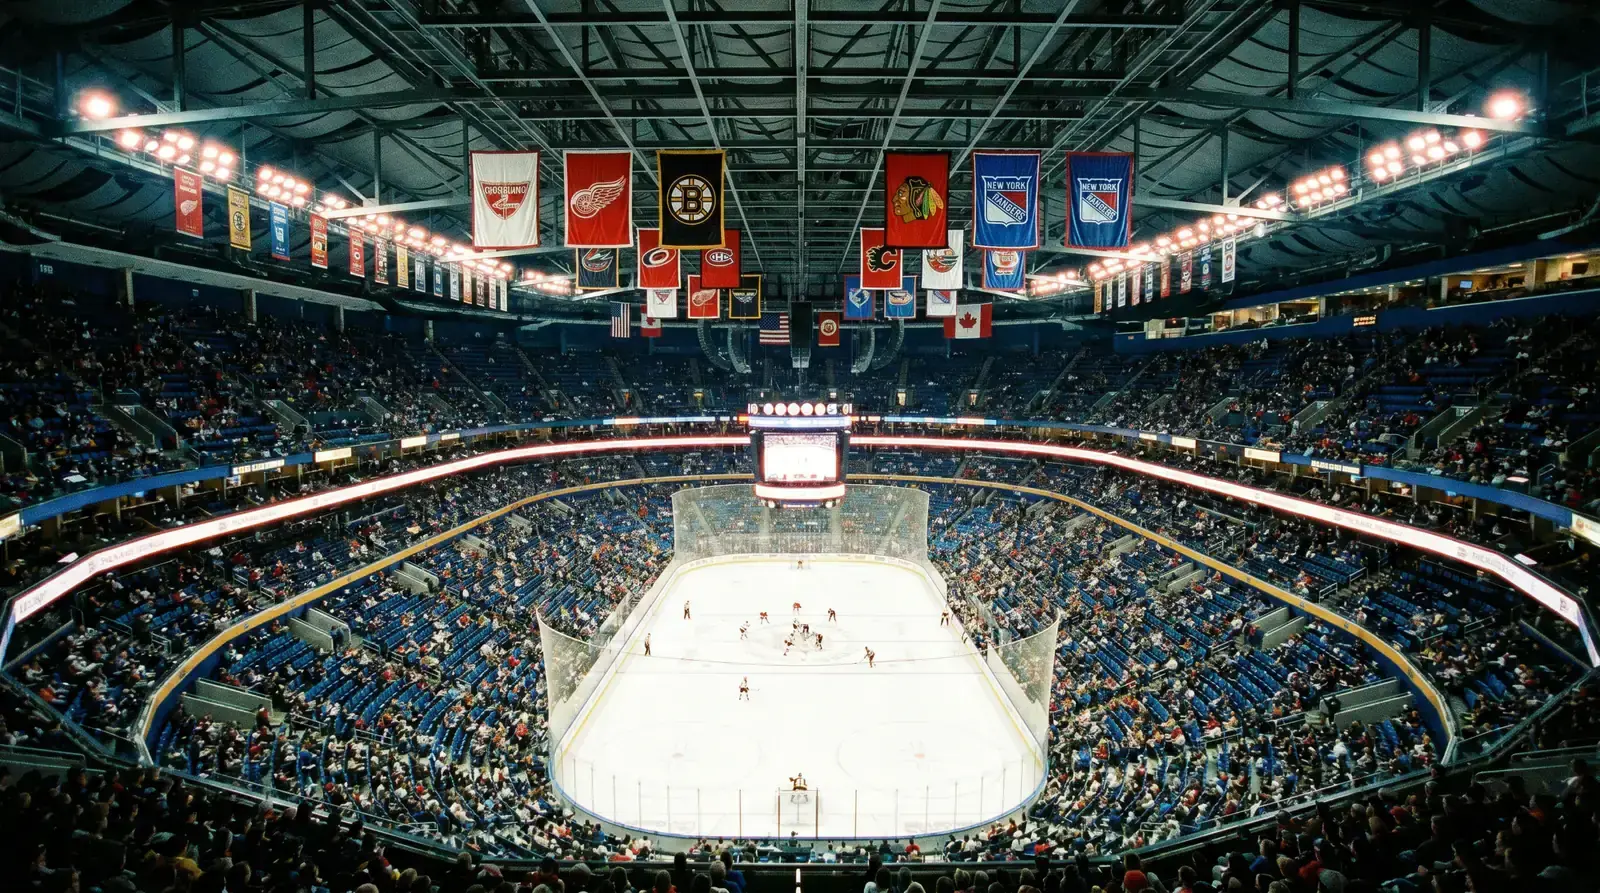
Ice quality varies too. Arenas that host NBA games on the same surface deal with suboptimal ice conditions, which changes puck movement and skating speed. I have tracked total goals in shared-venue arenas versus hockey-only venues, and shared facilities run about 0.3 goals higher per game on average. That is a marginal effect, but on a 6.5 total line, 0.3 goals of hidden upward pressure is worth noting.
Crowd dynamics play a subtler role than most people assume. The crowd does not make the players skate faster — what it does is influence officiating. Home teams draw more power plays per game than road teams, a trend documented across multiple decades. That officiating bias is small, typically half a power play per game, but power-play goals account for roughly 20% of all NHL scoring. Half an extra opportunity per game, multiplied across a season, adds up to a structural scoring advantage that feeds directly into home-ice win rates.
I also pay attention to which teams have the most vocal, intimidating fanbases. It is anecdotal, but my records show that Winnipeg, Nashville, and Boston consistently outperform their home-ice expected win rates, while teams in quieter or half-empty arenas underperform the league average at home. The data is not clean enough to isolate crowd effect from roster quality, but it is one more factor I weigh when the matchup is close and I need a tiebreaker.
Pricing Home Ice into Your Bets
The practical question is not whether home-ice advantage exists — it clearly does. The question is whether the bookmaker has already priced it in. On high-profile games between division rivals, the answer is usually yes. The line moves quickly, sharp money arrives early, and the price you see at 6pm UK time reflects an efficient market. On quieter Tuesday-night games between non-marquee teams, the adjustment can lag, particularly with UK-facing bookmakers who allocate less analytical resource to the NHL than to the Premier League.

My approach is to build a simple expected win-probability model that starts with each team’s season-long points percentage, adds a 3-4% home-ice bump for the home side, adjusts for back-to-back and travel factors, then compares my number to the implied probability of the bookmaker’s line. If the gap exceeds 5%, I have a candidate play. That threshold is deliberately conservative — I would rather miss a borderline play than chase a 2% edge that evaporates after juice.
Home-ice advantage in the NHL is neither magic nor obsolete. It is a measurable, persistent statistical phenomenon driven by last-change rights, travel mechanics, ice quality, and officiating patterns. The bettors who profit from it are the ones who stop treating it as a narrative and start treating it as a variable with a known distribution.
