

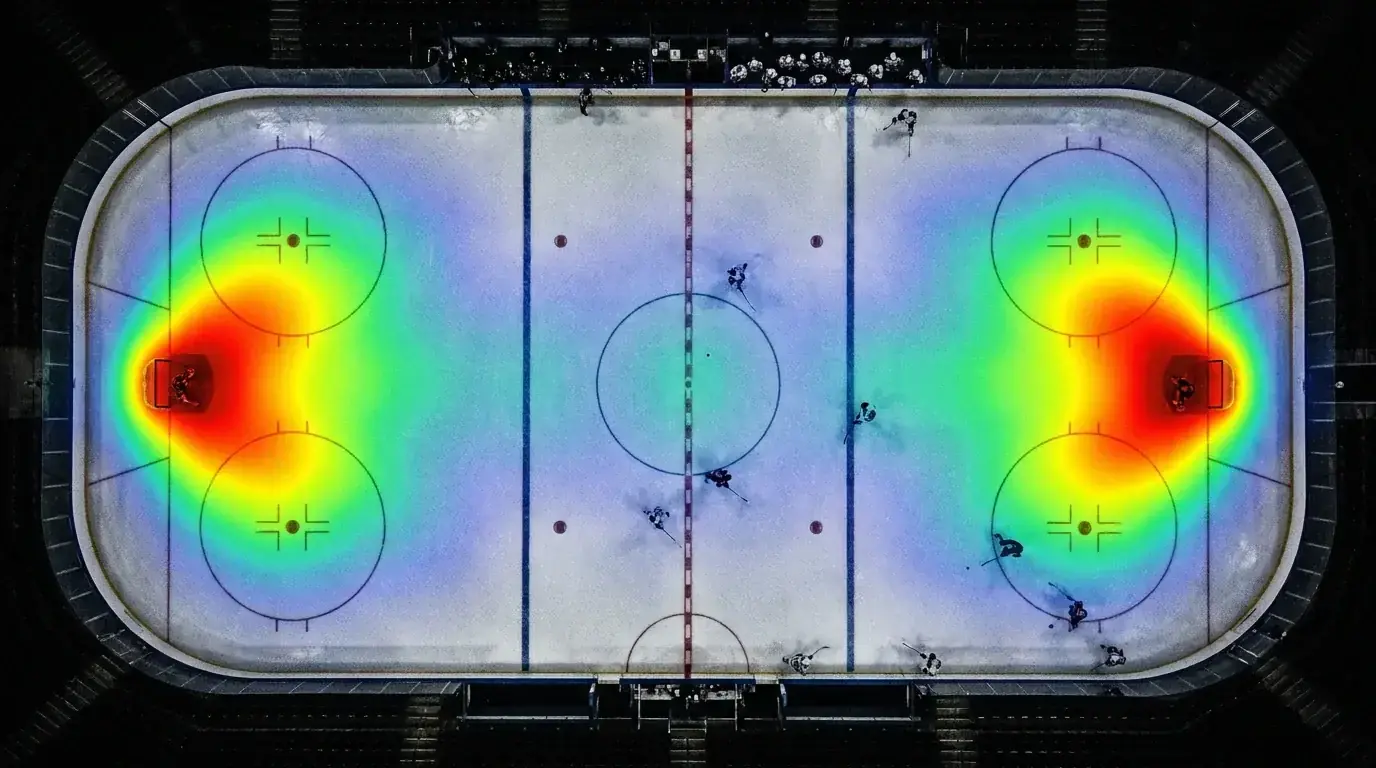
Expected goals changed my entire approach to NHL betting. Before I understood xG, I was evaluating teams by their actual goal totals — which is a bit like evaluating a poker player by the size of a single pot they won. Actual goals are outcomes contaminated by luck, hot goalies, and empty-net situations. Expected goals strip away the noise and show you what should have happened based on shot quality, location, and type. Once I started using xG as my baseline instead of the scoreboard, my moneyline and totals accuracy jumped noticeably within a single season.
What Is xG in Hockey
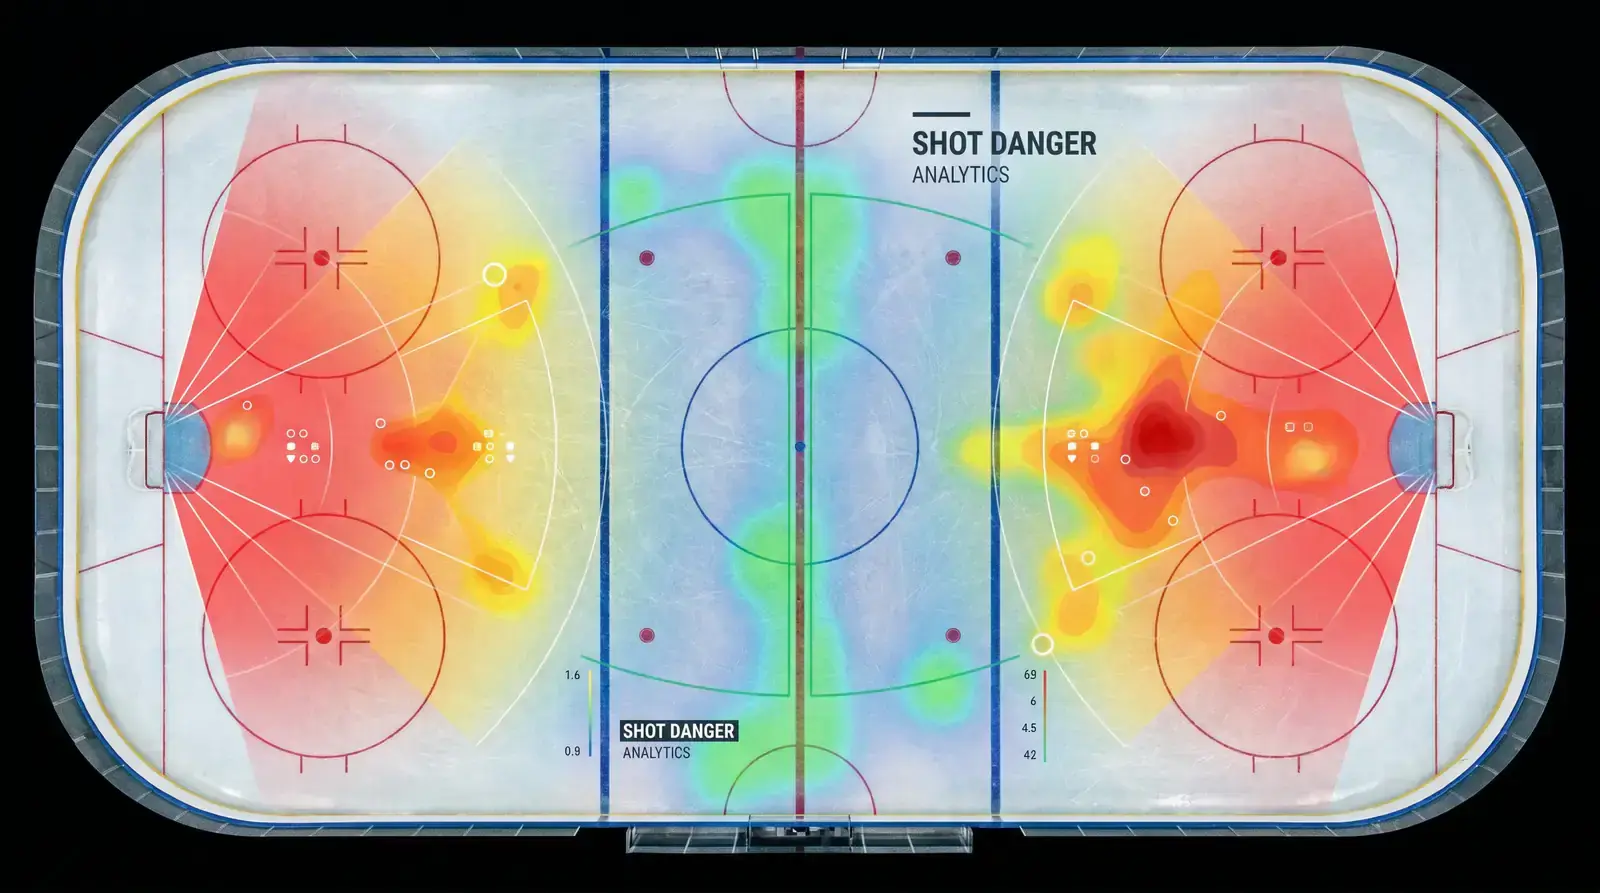
Expected goals is a model-derived metric that assigns a probability of scoring to every unblocked shot attempt based on its characteristics. A wrist shot from the slot might carry an xG of 0.12 — meaning that shot type, from that location, scores about 12% of the time across the historical dataset. A shot from the blue line might carry an xG of 0.02. Add up every shot’s xG value across a game, and you get a team’s total expected goals for that match.
Keith Wachtel, the NHL’s president of business, has talked about how the rising betting handle is lifting the entire sportsbook ecosystem. That growth has been driven partly by the availability of data that was invisible a decade ago — and xG sits at the centre of that data revolution. The league’s tracking systems now capture shot location, shot type, shooter speed, and even the angle to the net, all of which feed into publicly available xG models.
The key factors that determine a shot’s xG value are: distance from the net (closer is higher), angle to the net (centre is higher than the edges), shot type (deflections and rebound attempts carry the highest xG because the goalie is out of position), game state (power-play shots have slightly higher xG due to net-front traffic), and whether the shot is a rebound (second-chance shots catch goalies scrambling). The league-wide save percentage dropped to 89.6% in 2025-26, the lowest since 1993-94, which means the conversion rate on shots has increased — but xG models account for this by recalibrating to the current environment.
xG vs Actual Goals
Here is where the betting application begins. When a team’s actual goals significantly exceed their xG over a stretch of games, they are overperforming — their shooters are finishing at an unsustainable rate, or their goaltender is playing out of his mind, or both. When actual goals fall well below xG, the team is underperforming — they are generating quality chances but not converting. Both situations create betting opportunities because the market prices off what has happened (actual goals, wins, losses) while xG tells you what is likely to happen going forward.
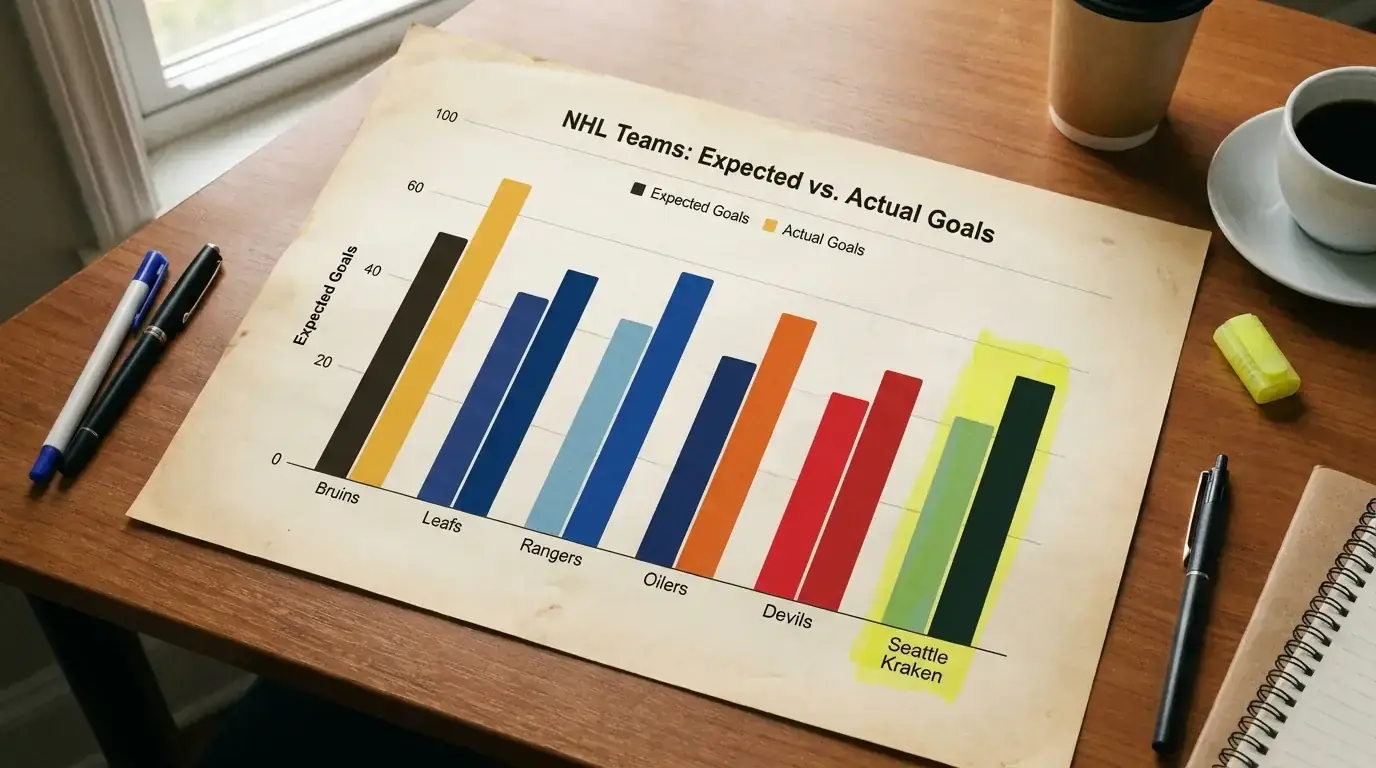
The most common total line in the NHL is 6.5 goals, and xG data directly informs how I approach that number. If two teams have a combined xG of 7.2 per game but their actual combined scoring sits at 5.8 due to hot goaltending, I lean over on the total. The goaltenders are due for regression, and the shot quality both teams generate supports higher scoring. Conversely, if two teams are scoring 7.5 goals per game but their combined xG is only 5.9, I lean under because the finishing rate is unsustainable.
I run this xG-versus-actual comparison on a rolling 10-game window rather than the full season. Season-long xG is useful for identifying fundamental team quality, but the betting edge lives in the recent trend. A team that shifted to a more aggressive system three weeks ago will not reflect that change in their season xG number, but the rolling window catches it. My filter is simple: if the gap between rolling xG and rolling actual goals exceeds 0.5 per game in either direction, I flag the team for a regression play on the totals market.
Using xG for Totals Bets
The practical application of xG for totals is a three-step process that I run every game day.

Step one: pull each team’s xG for and xG against from a public data source. Add the home team’s xG for to the away team’s xG against, and vice versa. This gives you two numbers: the expected goals the home team should generate against this specific opponent’s defensive quality, and the same for the away team. Sum those two numbers for a total expected goals estimate.
Step two: compare your estimate to the bookmaker’s posted total. If your number is 7.1 and the line is 6.5, you have a potential over play. If your number is 5.8 and the line is 6.5, you have a potential under play. But do not bet yet — step three adds the situational layer.
Step three: adjust for goaltender quality, rest, and schedule context. If the home team is starting a goaltender with a save percentage above .920, subtract 0.3 from your estimate. If one team is on the second night of a back-to-back with their backup in net, add 0.4 to your estimate. If the game is a rivalry matchup where both teams historically play tight, subtract 0.2. These adjustments are based on my own tracking data, and yours may differ — the point is that raw xG is the starting point, not the final answer.
This process takes me about five minutes per game, and I run it for every game on the board before selecting the one or two plays where the gap between my estimate and the bookmaker’s line is widest. That discipline — running the numbers on every game before picking the best opportunities — is what separates xG-informed betting from xG-adjacent guesswork. The data is freely available through sites like Natural Stat Trick and Hockey Reference, which means the only barrier is the willingness to build the habit.

The Limits of xG
I would be dishonest if I presented xG as a magic formula. It has real limitations, and ignoring them will cost you money. The biggest limitation is that xG models do not capture shooter talent. A shot from the slot by Connor McDavid is more dangerous than the same shot from a fourth-line centre, but most public xG models assign the same value to both. Some premium models adjust for shooter quality, but the free versions — which is what most bettors use — do not.

xG also struggles with sample size in the early season. Through October, teams have played only 10-12 games, which is not enough for xG to stabilise. I do not trust xG-based betting plays until mid-November, when the rolling windows have enough data to be meaningful. Before that, I rely on pre-season projections and qualitative assessment of roster changes. xG is a powerful tool, but it is a tool — not a system. It needs human judgment to interpret context, filter noise, and make the final call.
