


Save percentage is the first number I check before placing any NHL bet. Not Corsi, not expected goals, not even the moneyline price — the goaltender’s save rate tells me more about the likely shape of the game than any other single metric. And in the 2025-26 season, that metric delivered a jolt: the league-wide average save percentage dropped to 89.6%, falling below 90% for the first time since 1993-94. That decline is not a curiosity. It is a structural shift that changes how every bettor should evaluate goaltending, price totals, and assess moneyline value.
Historical Save Percentage Benchmarks
The all-time average save percentage in the NHL is .908. For decades, that number served as the dividing line between acceptable and below-average goaltending. A starter posting .910 was considered slightly above average — reliable but not spectacular. A goaltender maintaining .920 or above was elite, the kind of netminder who could single-handedly swing a playoff series. Those thresholds were stable for so long that bettors, analysts, and even coaches treated them as fixed reference points.
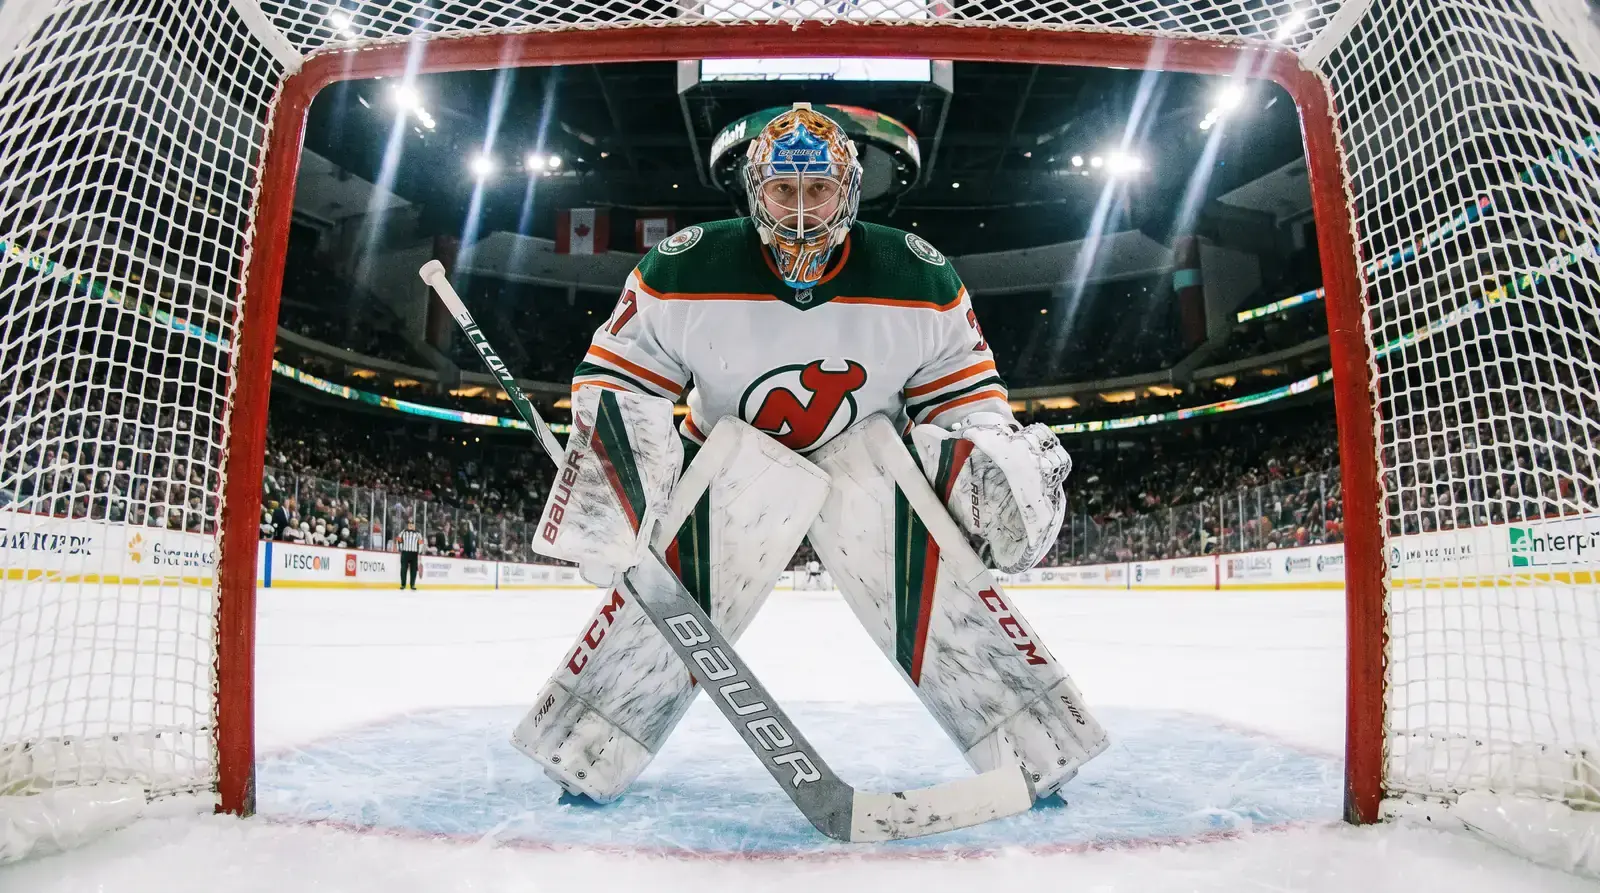
Gary Bettman has spoken repeatedly about his confidence in the integrity of the game, saying he really has confidence in the NHL’s product and the integrity that players and personnel bring to every contest. That integrity extends to the playing rules that shape save percentages — equipment regulations, goaltender interference standards, and crease rules all influence how effectively netminders can stop pucks. When the league tightens equipment specifications or adjusts enforcement of interference calls, the downstream effect on save rates is measurable and bettable.
Jesper Wallstedt led the league with a .936 save percentage in 2025-26, a number that would have been exceptional in any era but is especially striking against the backdrop of a depressed league average. The gap between Wallstedt and the average starter — roughly 40 points of save percentage — is wider than it has been in a generation. For bettors, that gap means the goaltender matchup has become more impactful than ever: the difference between facing an elite netminder and a league-average one translates to roughly 1.0 to 1.5 expected goals per game, a massive effect on both totals and moneyline pricing.
The 2025-26 Save Percentage Decline
Why did save percentage fall below .900 this season? The causes are layered and reinforcing. Lighter, more streamlined goaltender equipment means smaller blocking surfaces. Skaters are shooting harder and from tighter angles, aided by improved stick technology and training regimes that emphasise shot accuracy. Rule enforcement around net-front traffic has loosened slightly, allowing more screens, deflections, and rebounds — the shot types that carry the highest expected-goal values.

The practical effect for bettors is that the old thresholds no longer apply in their traditional form. A .910 save percentage no longer signals “slightly above average” — in the current environment, .910 is comfortably above the league mean and represents a goaltender who is outperforming the field. I have recalibrated my tiers accordingly: below .895 is poor, .895 to .905 is average, .905 to .915 is above average, and above .915 is elite. Those bands are specific to the current era and will need adjustment if league-wide save rates recover, but for the 2025-26 season and likely the 2026-27 campaign as well, they are the benchmarks I use.
For totals, the decline in save percentage produces a structural lean toward the over. When the average goaltender stops fewer pucks, games produce more goals. The most common total line remains 6.5, but I treat that number differently than I would have three seasons ago. My baseline expectation for combined scoring is higher, which means I need a stronger analytical case to back the under than I did when the league average sat at .908. The 52.9% over rate in 2025-26 confirms that lean — overs have a slight but persistent statistical tailwind in the current environment.
Save Percentage as a Betting Filter
I use save percentage as a binary filter before I even look at the odds. If both confirmed starters carry season save percentages above .910, I lean under on the total and require additional factors before backing the over. If one starter is below .895 on the season, I lean over and look for confirmation in the opposing team’s shot volume and expected-goals generation.

The filter extends to the moneyline. A team starting a goaltender with a save percentage above .915 against one below .895 has a goaltending edge worth roughly 1.2 expected goals per game in my model. That is an enormous advantage — comparable to the gap between the best and worst offences in the league. If the moneyline does not reflect that gap, I have a value bet. More often than not, the market underprices goaltending because the public anchors on team records and offensive reputation rather than on who is actually standing between the pipes.
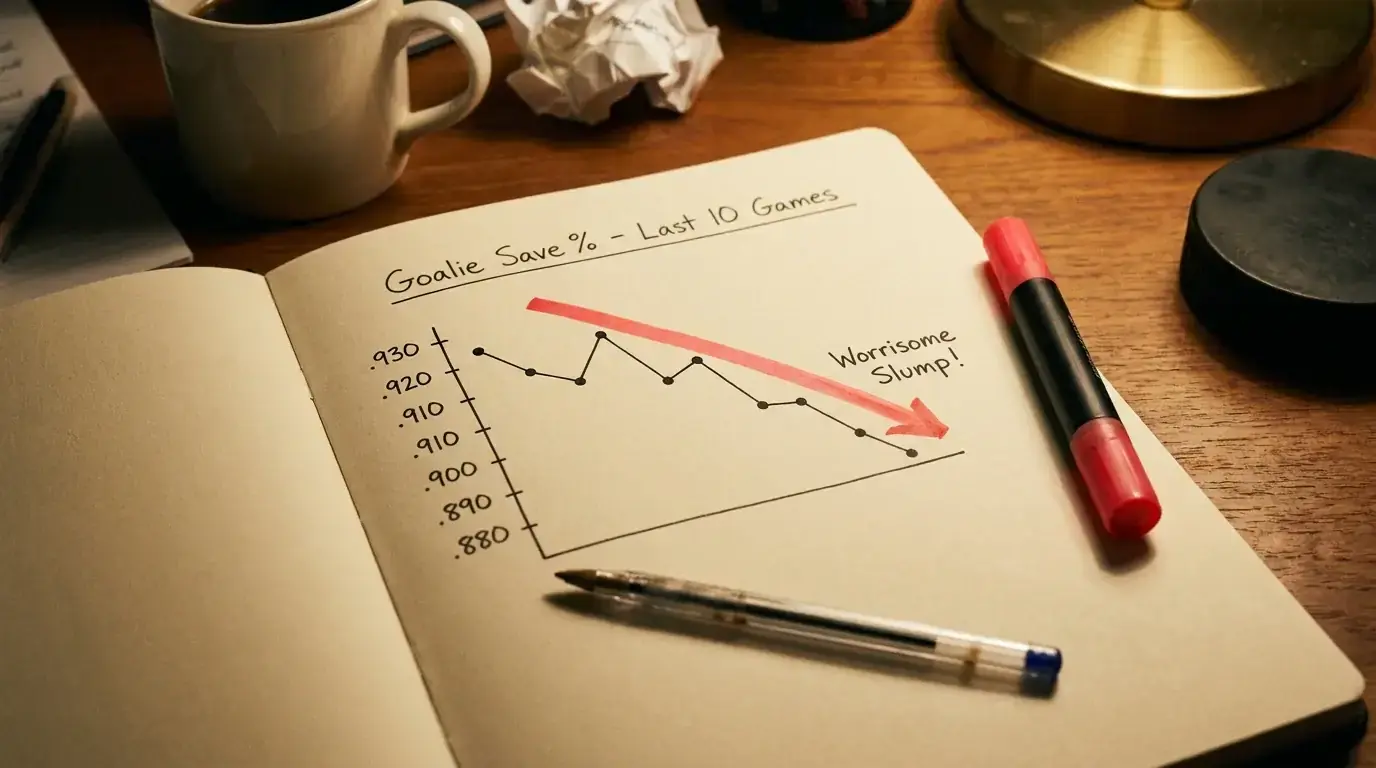
One mistake I made early in my career was using season-long save percentages without considering rolling form. A goaltender with a .912 season average might have posted .880 over his last five starts. The season number still looks respectable, but the recent form suggests a struggling netminder whose confidence or conditioning has deteriorated. I now use a dual filter: season average above a threshold AND rolling five-game average above a slightly lower threshold. Both conditions must be met for me to classify the goaltender as “above average” for betting purposes.
When the Numbers Lie
Save percentage is a blunt instrument. It treats all shots equally — a routine wrist shot from the perimeter counts the same as a cross-crease one-timer from the slot. A goaltender facing 25 high-danger shots per game will post a lower save percentage than one facing 30 shots from the blue line, even if the first goalie is objectively better. That is why I never use save percentage in isolation. I pair it with high-danger save percentage and expected save percentage to triangulate a goaltender’s true performance level.

But for a quick, accessible, pre-bet screening tool, nothing beats raw save percentage. It is available everywhere, it is updated daily, and it captures enough of the goaltending picture to serve as a reliable first filter. The bettors who skip this step — who look at team names and moneyline prices without checking who is in goal and how he has been performing — are leaving the most predictive variable in the NHL unexamined. In a season where the league-wide save rate has cratered, that oversight is more costly than ever.
