


I first heard about Corsi from a hockey analytics blog in 2018, and my initial reaction was dismissive — “just count the shots, surely?” But Corsi is not about shots. It is about shot attempts, which includes shots that miss the net and shots that get blocked. That distinction matters enormously, because a team generating 60 shot attempts per game but only putting 28 on target is doing something fundamentally different from a team generating 45 attempts and putting 32 on net. Corsi captures the full picture of territorial dominance, and once I started incorporating it into my NHL betting, the quality of my game assessments improved immediately.
Corsi: Definition and Use
Corsi measures all shot attempts — shots on goal, missed shots, and blocked shots — at even strength. The metric is expressed as a percentage: Corsi For divided by Corsi For plus Corsi Against, multiplied by 100. A team with a Corsi of 55% is generating 55% of all shot attempts when the score is even, which means they are controlling play. A team at 45% is getting outworked in the possession battle.

Home teams won 56.6% of their games in 2024-25, and Corsi helps explain why: home teams tend to have higher Corsi percentages because of the last-change advantage, which allows coaches to deploy their top offensive lines against the opponent’s weaker defensive pairings. That matchup control inflates shot attempt volumes at home, and it is one reason why home Corsi and road Corsi should be treated as separate datasets in your analysis.
Keith Wachtel has noted the growing sportsbook handle as more money flows into NHL markets. That growth means the market is getting sharper, and basic information like win-loss records and goals scored is fully priced in. Corsi gives you a view beneath the surface — it identifies teams that are playing well but losing due to poor goaltending or bad luck, and teams that are winning despite being outplayed. Both situations create betting value because the market prices off results, not process.
Fenwick vs Corsi
Fenwick is Corsi’s sibling, with one key difference: it excludes blocked shots. The logic is that a blocked shot never had a chance of reaching the net, so including it overstates a team’s offensive generation. A team that fires 20 shots at the net and has 15 blocked is generating 35 Corsi attempts but only 20 Fenwick attempts. The Fenwick view argues that those 15 blocks were effectively neutralised by the defence and should not count as offensive events.

In practice, the two metrics correlate at above 0.95 across a full season, which means they tell almost the same story most of the time. Where they diverge is in matchups involving teams with extreme shot-blocking tendencies. A team like the New York Islanders, historically a high-blocking side, will show a lower Corsi Against (more shot attempts against, since blocks count) but a Fenwick that looks better because those blocked shots are removed. If you are betting on a game involving a heavy shot-blocking team, Fenwick may give you a truer picture of their defensive effectiveness.
I use both, but I default to Corsi for most of my analysis because blocked shots still represent an offensive attempt and a sign of territorial pressure. The team doing the blocking is under siege, even if the shots are not reaching the goalie. For totals betting, Corsi is the better indicator of game pace, while Fenwick is more useful for goaltender workload analysis — if you are betting a goaltender saves prop, Fenwick-based shot estimates are more relevant than Corsi.
Practical Thresholds
The question every bettor asks about Corsi is: what number should I look for? The answer is not a single number but a range that separates tiers of team quality.
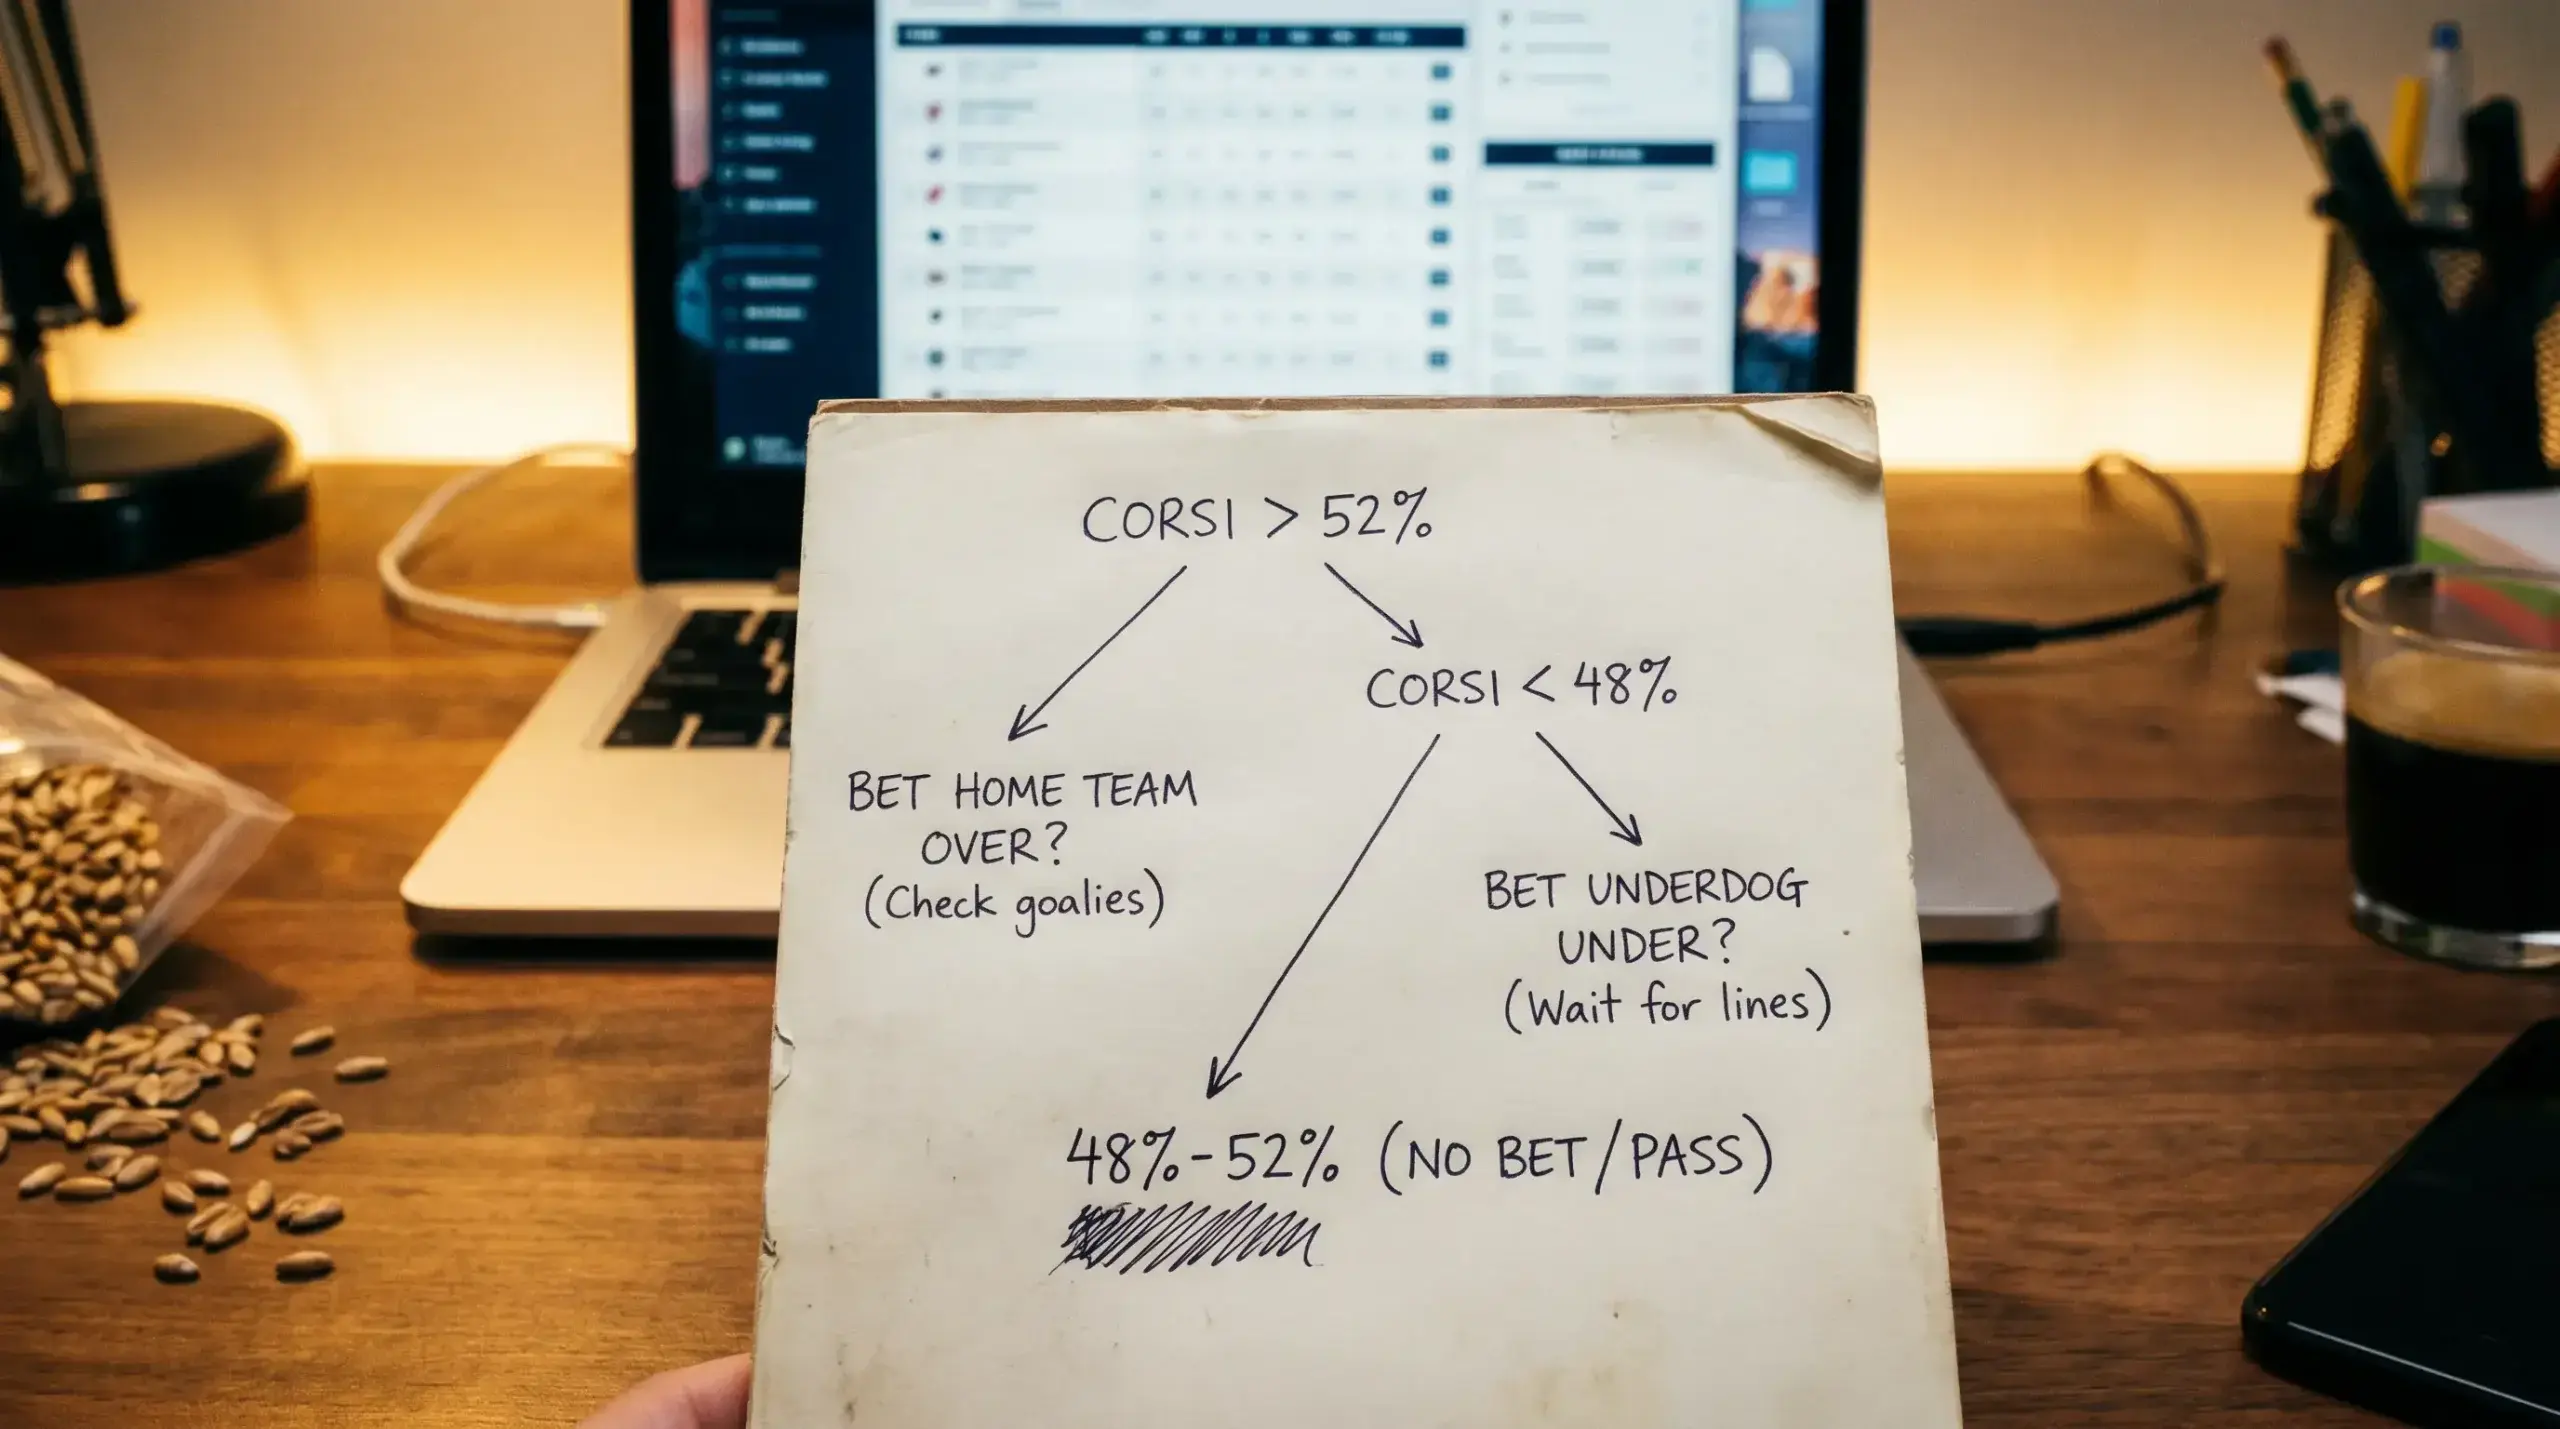
A Corsi above 52% at even strength is above average. Above 54% indicates a team that is consistently controlling play. Above 56% is elite — typically reserved for two or three teams per season. Below 48% signals a team that is being outplayed regularly, and below 46% is the danger zone where even strong goaltending cannot bail out the team forever.
NHL underdogs won 39.1% of games in 2024-25. When I filter for underdogs with a Corsi above 52%, that win rate climbs above 44% in my sample. The market does not fully price in possession dominance for teams that are losing games due to poor goaltending or finishing. Backing an underdog who controls the shot-attempt battle is one of the most reliable angles I have found, and it requires nothing more than checking a freely available number before placing the bet.
For totals, I look at the combined Corsi of both teams. Two teams with Corsi above 52% will produce a high-event game with lots of shot attempts, which tends to push the game toward the over on the total. Two teams below 48% produce a slower game. One high-Corsi team against one low-Corsi team creates an asymmetric game that is harder to predict on totals but often favours the higher-possession side on the moneyline.

Applying Corsi Without Overcomplicating It
The trap with possession metrics is analysis paralysis. I have watched bettors spend so long dissecting Corsi data that they miss the line movement window and end up betting at worse odds than they would have gotten by simply trusting their initial read. Corsi is a filter, not a forecast. It tells you which games deserve your attention and which sides are undervalued. It does not tell you who will win.

My daily process: I pull 5v5 Corsi data for every team playing that night, flag any team with a Corsi above 53% that is priced as an underdog, and cross-reference with goaltender confirmation. If the underdog’s Corsi is strong and their goaltender is confirmed and competent, I have a candidate bet. The entire process takes ten minutes. Ten minutes of data work that separates a disciplined bettor from someone picking names out of a hat.
