

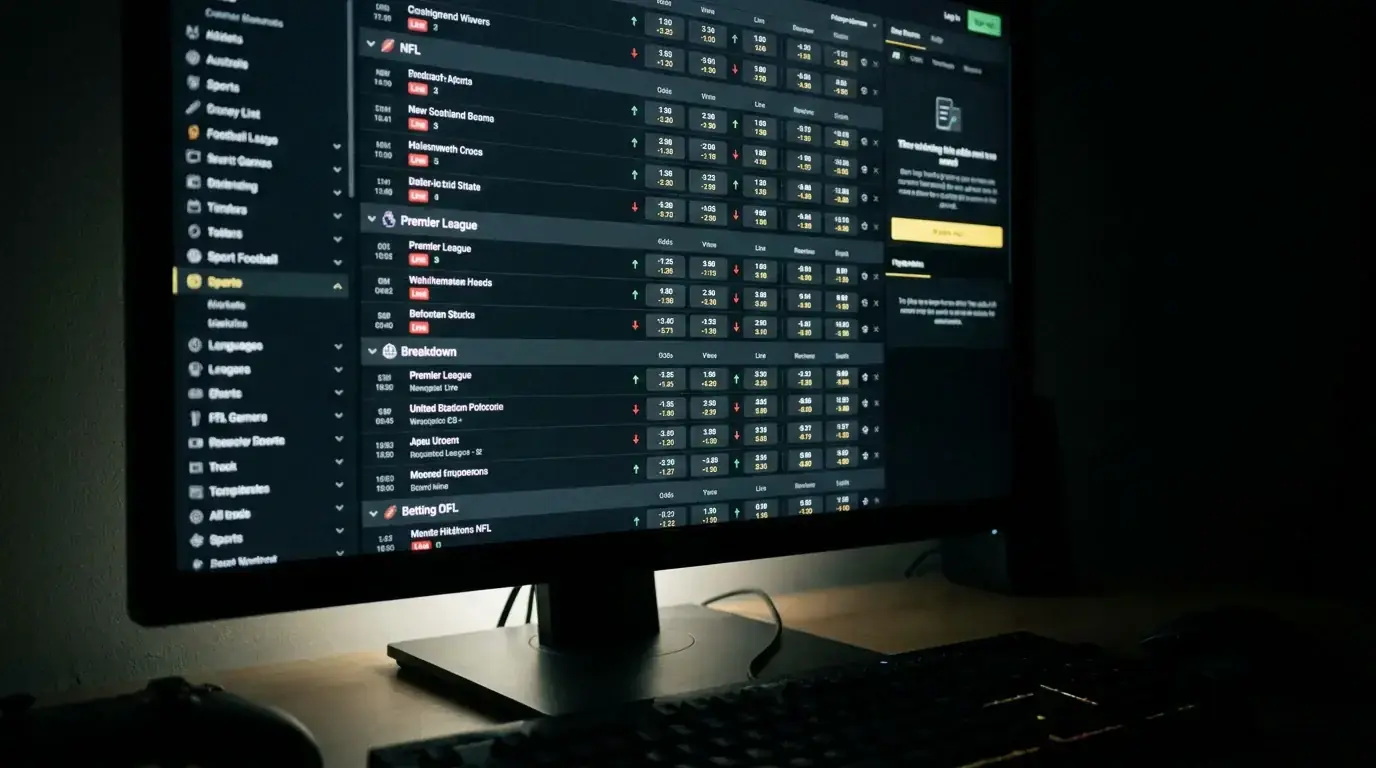
The first time I saw a line move against the betting percentages, I assumed it was a mistake. Seventy percent of bets were on the favourite, yet the line drifted in the underdog’s direction. It made no sense — until I understood that not all money is created equal. A hundred casual bettors placing 10-pound wagers move the line less than one syndicate placing 10,000 pounds on the other side. That asymmetry between the number of bets and the volume of money is the foundation of sharp-versus-public analysis, and it is one of the most actionable edges available to UK NHL bettors willing to pay attention.
Hockey accounts for roughly 11% of the total sports betting handle in the United States, a smaller share than football or basketball. That relative obscurity means the NHL market is less efficient than the NFL or NBA, which gives sharp bettors more room to operate and public money more room to distort the line. The same structural feature that makes the NHL a softer market for analytical bettors also makes it the ideal sport for tracking sharp-versus-public dynamics.
Sharp vs Public Money
Public money flows toward favourites, toward teams on winning streaks, and toward nationally televised games. It is driven by brand recognition, recent results, and media narratives. Sharp money flows toward value — toward lines that are mispriced relative to the true probability of the outcome, regardless of which side the public prefers.

In 2025, legal US sportsbooks processed 165.58 billion dollars in cumulative handle. Jim Strode, a sports betting professor at Ohio University, has noted how the familiarity of NHL and PWHL players drives engagement, recognising that bettors identify with the athletes they watch regularly. That emotional connection fuels public money. Sharp money has no emotional connection — it follows the numbers, and when the numbers say an unpopular underdog is mispriced, the sharp money arrives regardless of narrative.
I track three data points daily during the NHL season: the percentage of bets on each side (public betting percentage), the percentage of money on each side (money percentage), and the direction of line movement. When these three indicators diverge — for example, 70% of bets on the favourite but only 45% of money, with the line moving toward the underdog — the signal is clear: sharp money has taken the underdog, and the bookmaker is adjusting the line in response to volume rather than ticket count.
Reverse Line Movement
Reverse line movement is the single most reliable indicator of sharp activity in the NHL market. It occurs when the line moves opposite to the direction the public betting percentages would suggest. If 65% of bets are on the home team and the home team’s odds drift from 1.80 to 1.85, someone with significant money has bet the other side. That someone is almost always a syndicate, a model-based operation, or a respected sharp bettor whose wagers the bookmaker respects enough to move the line.

NHL underdogs won 39.1% of games in 2024-25, and my tracking shows that underdogs receiving reverse line movement won at a notably higher rate than that baseline. The explanation is straightforward: reverse line movement identifies spots where the sharp consensus disagrees with the public, and sharp bettors have a demonstrated long-term edge over the public. Aligning with the sharp side does not guarantee a win — no filter does — but it tilts the probability distribution in your favour over a large sample of bets.
The timing of reverse line movement matters. Movement that occurs between 9am and 12pm Eastern time on game day — that is 2pm to 5pm UK time — is the most significant because it coincides with the window when professional bettors in North America are most active. Movement in the final hour before puck drop is less reliable because it can be driven by late injury news, last-minute public surges, or bookmaker line management rather than genuine sharp opinion.
Using Percentages as a Filter
I do not bet based on sharp-versus-public data alone. I use it as a confirming or disconfirming filter on top of my primary analysis. If my goaltending evaluation, schedule-spot assessment, and matchup data all point to the underdog, and the sharp money indicators confirm that lean, I increase my confidence in the play. If my analysis says underdog but the sharp indicators point to the favourite, I pause and re-examine my assumptions before committing.

The percentage thresholds I use are practical, not theoretical. When the public betting percentage exceeds 70% on one side and the money percentage is below 50% on that same side, I flag the game for reverse line movement monitoring. When the public percentage exceeds 75% and the line has moved toward the minority side by 0.10 or more in decimal odds, I treat the minority side as a strong candidate — provided my independent analysis does not contradict the signal.
One caution for UK bettors: most public betting percentage data originates from US-facing sportsbooks and may not perfectly reflect the line at your UKGC-licensed operator. The directional signal — which side the sharp money favours — transfers reliably across markets, but the exact line movement and percentage splits will differ between your UK book and the US data source. I use the US data for the directional signal and then check whether my UK bookmaker’s line has adjusted similarly or lagged behind. When the UK line has not yet moved to match the US sharp action, the window of value is widest.

Where to Find the Data
Several free and subscription websites publish NHL public betting percentages and money percentages. The free versions typically show bet percentages only; the premium tiers add money percentages and line-movement timelines. I use one free source for the initial screen and one paid source for the money-percentage confirmation. The combined cost is roughly the price of a single losing bet per month, which makes it one of the highest-returning investments in my betting toolkit.

The key is consistency. I check the data at the same time every day — 3pm UK time — and run the same filter. Games that meet my criteria go onto a shortlist. Games that do not are ignored regardless of how interesting the matchup looks on paper. That routine removes the temptation to chase action on games where no sharp signal exists, and it keeps my attention focused on the two or three plays per night where the confluence of analytical and market-based evidence is strongest.
